
 Алгебра
 Английский
 Биология
 География
 Геометрия
 История
 Русский
 Обществознание
 Физика
 Химия
Химия Информатика
 Литература
 Математика
Вопрос:
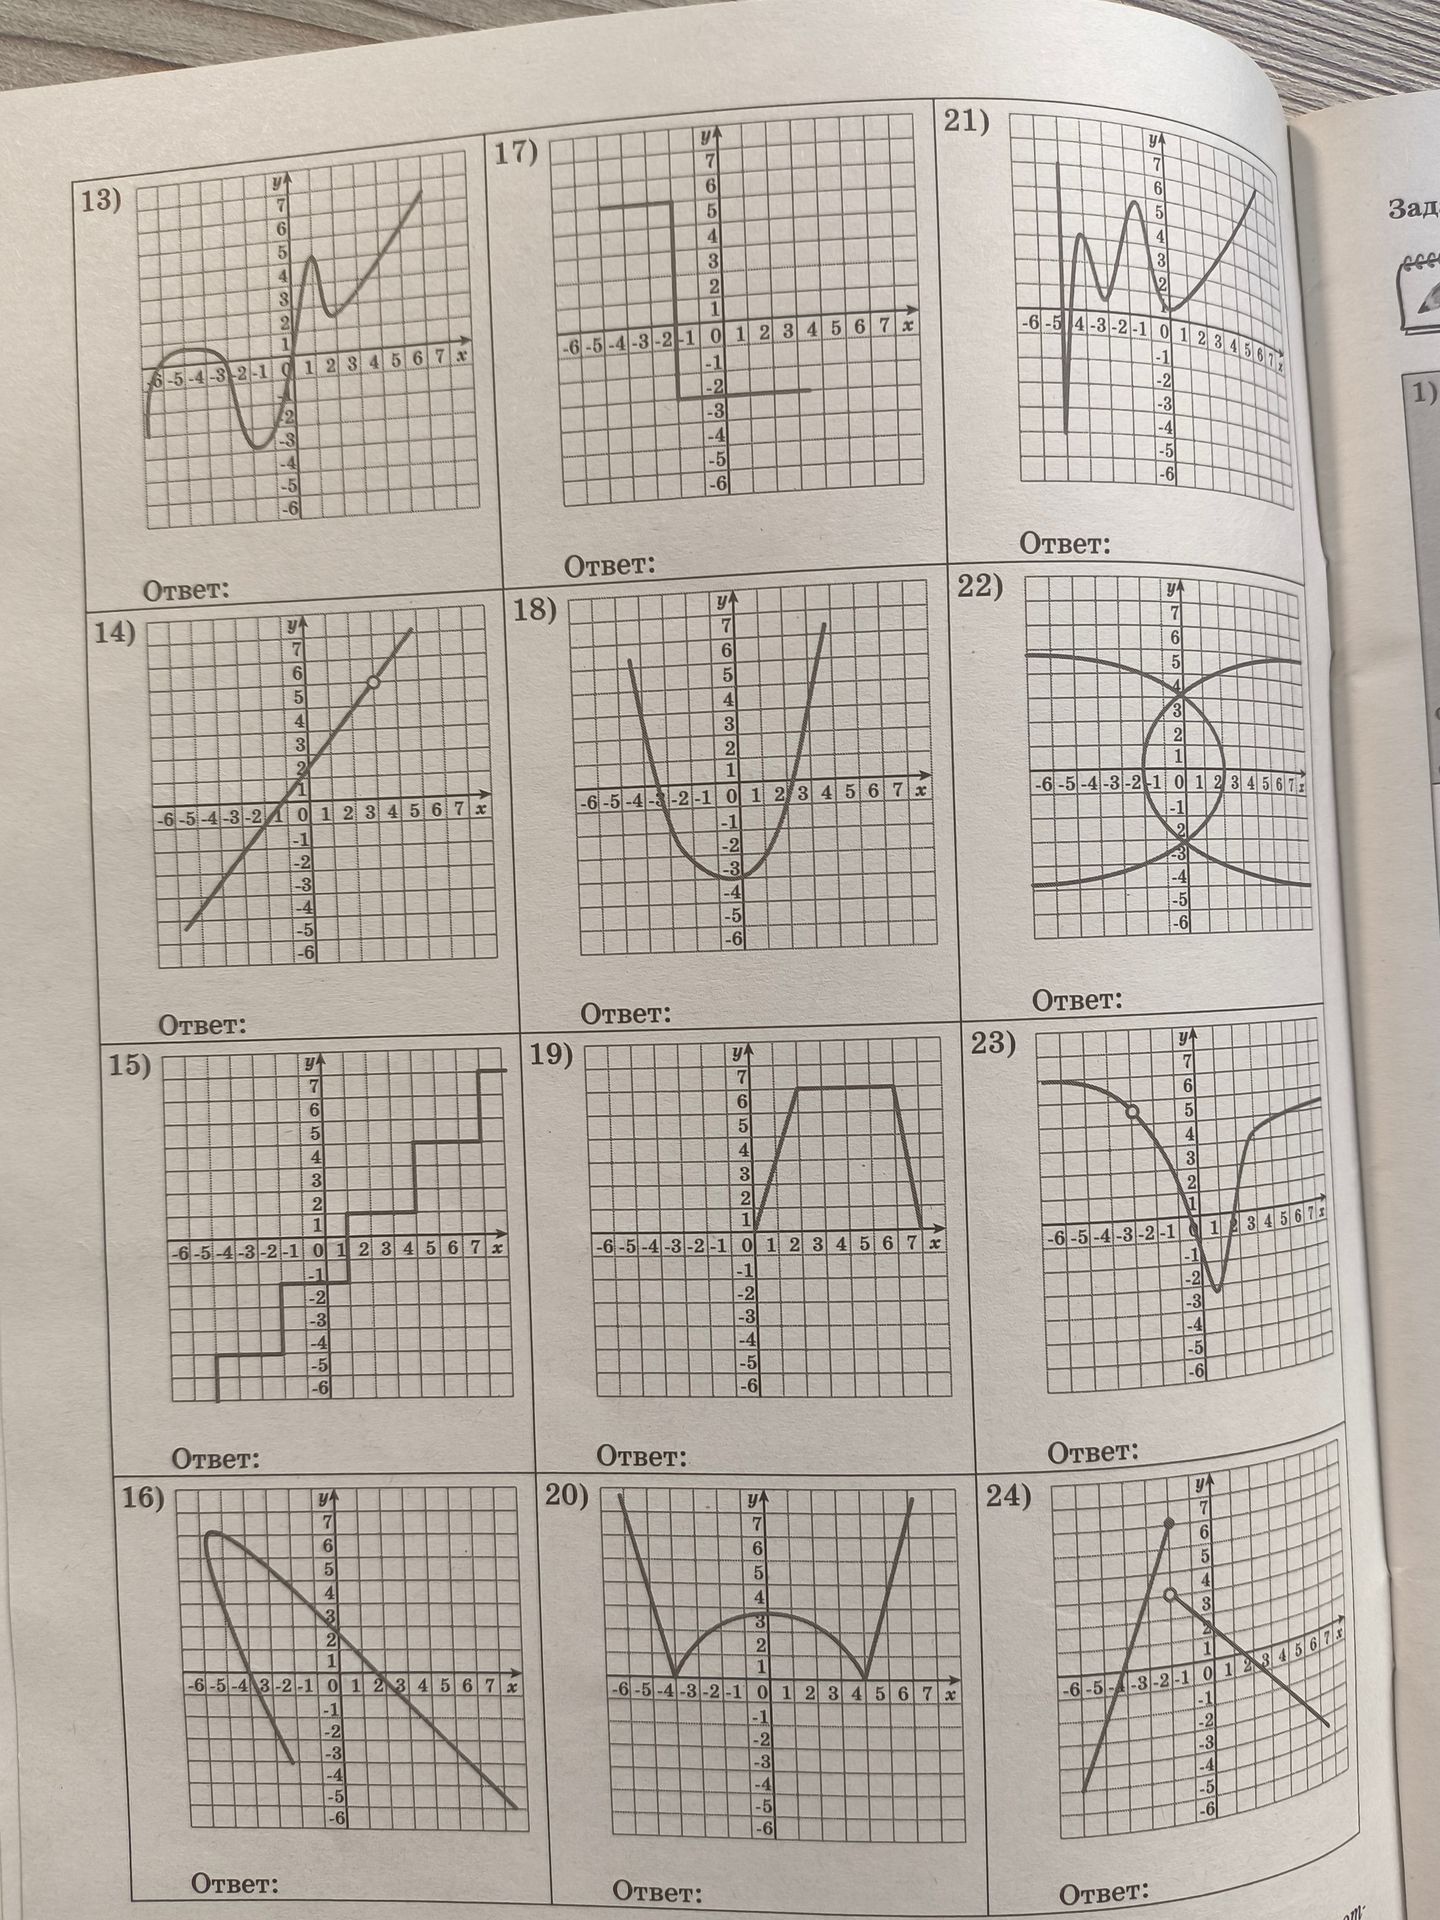
17) Plot the graph of the function.
Ответ:
Solution:
The graph shows a piecewise constant function. For x from -6 to 0 (exclusive of 0), y = -2. For x = 0, y = 1. For x from 0 (exclusive of 0) to 7, y = 1.
Answer: The graph of the function is shown above.
Похожие
- 13) Plot the graph of the function.
- 14) Plot the graph of the function.
- 15) Plot the graph of the function.
- 16) Plot the graph of the function.
- 18) Plot the graph of the function.
- 19) Plot the graph of the function.
- 20) Plot the graph of the function.
- 21) Plot the graph of the function.
- 22) Plot the graph of the function.
- 23) Plot the graph of the function.
- 24) Plot the graph of the function.
