
 Алгебра
 Английский
 Биология
 География
 Геометрия
 История
 Русский
 Обществознание
 Физика
 Химия
Химия Информатика
 Литература
 Математика
Analyze the graphs and determine the relationship between the function y = f(x) and its tangent line at point x_0 in each of the given scenarios.
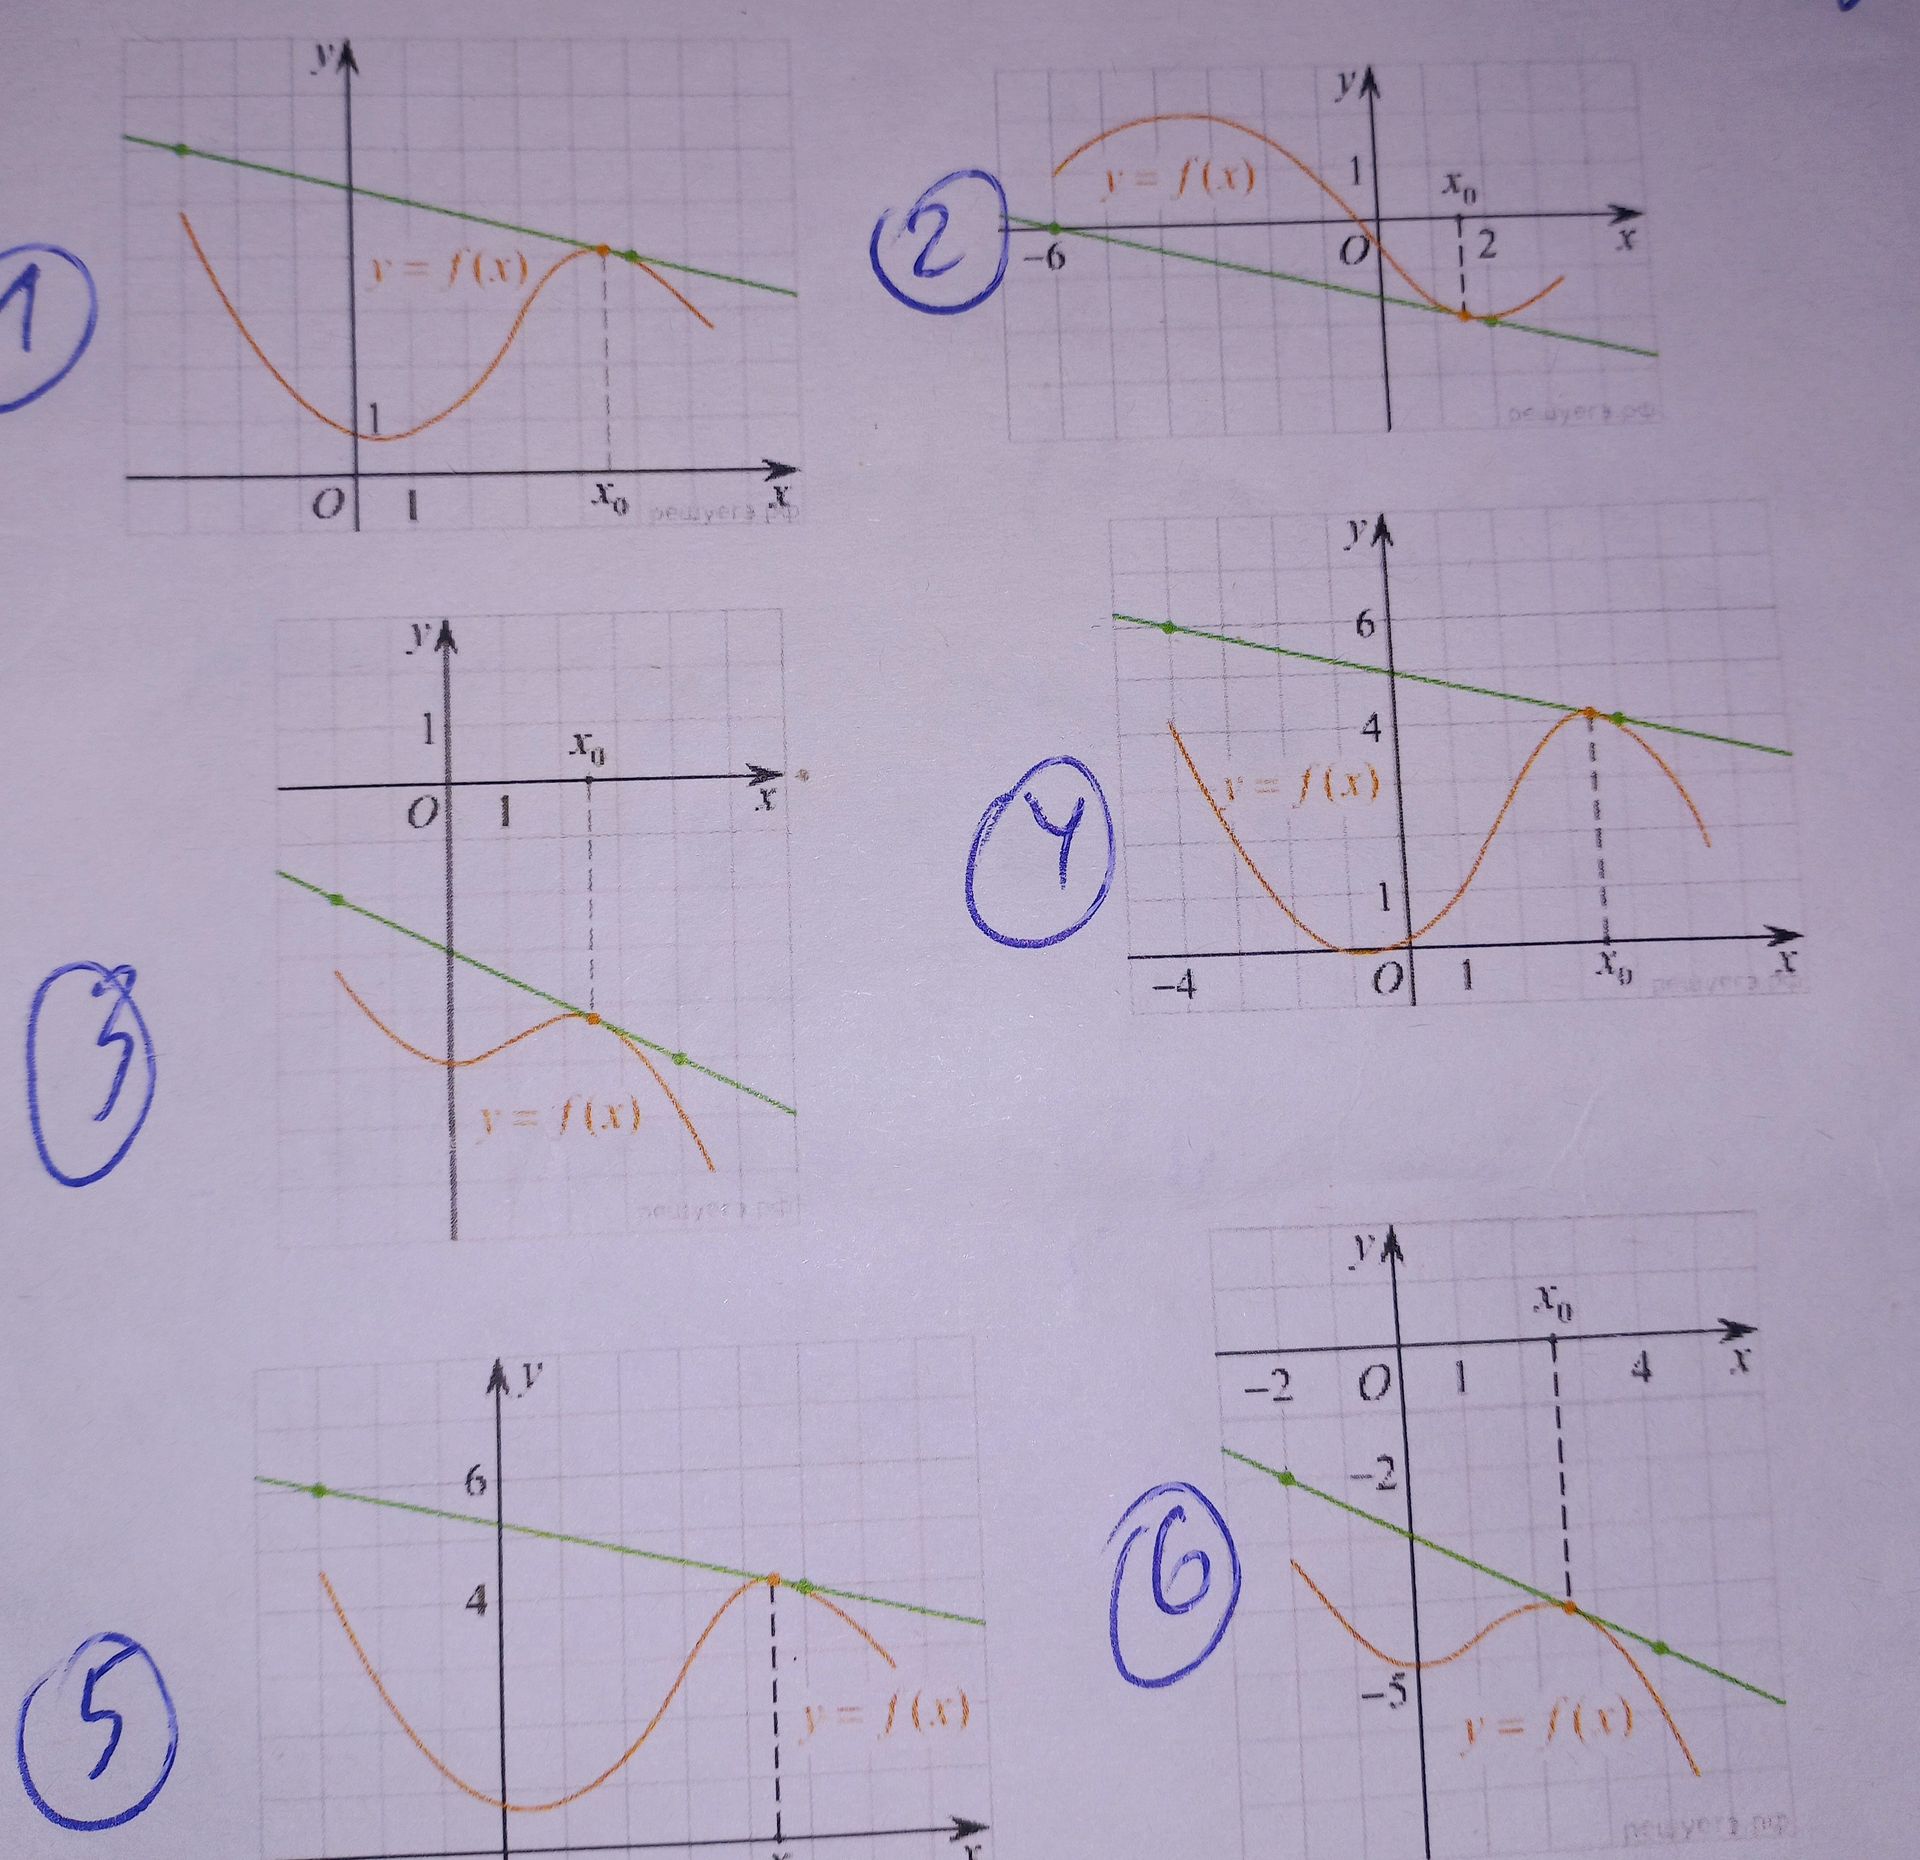
Ответ:
Analysis of Graphs:
The image displays six graphs, each illustrating a function \( y = f(x) \) (orange curve) and a tangent line (green line) at a specific point \( x_0 \).
Scenario 1:
The tangent line at \( x_0 \) is below the curve \( y = f(x) \) at that point, indicating that the slope of the tangent line is less than the slope of the function at \( x_0 \). The function appears to be concave up at \( x_0 \).
Scenario 2:
The tangent line at \( x_0 \) intersects the curve \( y = f(x) \) at \( x_0 \) and appears to be above the curve on the left side and below on the right side, suggesting a change in concavity or a point of inflection.
Scenario 3:
Similar to scenario 1, the tangent line at \( x_0 \) is below the curve \( y = f(x) \) at that point. The function appears to be concave up at \( x_0 \).
Scenario 4:
The tangent line at \( x_0 \) touches the curve \( y = f(x) \) at its maximum point. The slope of the tangent line is zero at \( x_0 \), and the function is concave down at \( x_0 \).
Scenario 5:
The tangent line at \( x_0 \) touches the curve \( y = f(x) \) at its minimum point. The slope of the tangent line is zero at \( x_0 \), and the function is concave up at \( x_0 \).
Scenario 6:
The tangent line at \( x_0 \) is below the curve \( y = f(x) \) at that point. The function appears to be concave down at \( x_0 \).
General Observation: In all cases, the green line represents the tangent to the orange curve \( y = f(x) \) at the point \( x_0 \). The behavior of the curve relative to the tangent line (above, below, or intersecting) provides information about the concavity and the value of the derivative at \( x_0 \).
