
 Алгебра
 Английский
 Биология
 География
 Геометрия
 История
 Русский
 Обществознание
 Физика
 Химия
Химия Информатика
 Литература
 Математика
Вопрос:
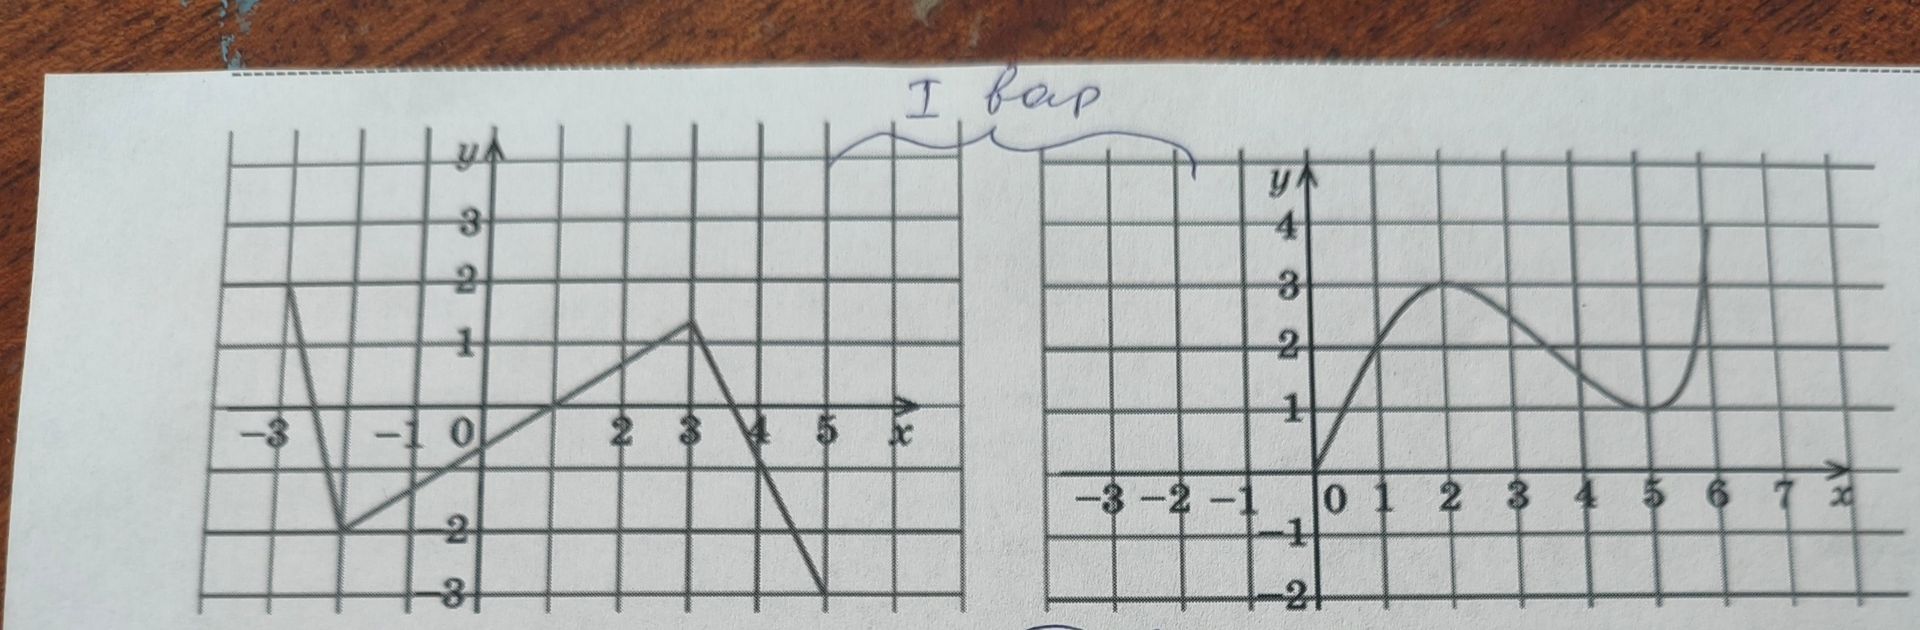
Analyze the graphs provided. Provide the coordinates of key points for each graph.
Ответ:
Analysis of Graphs:
The image displays two separate graphs on a grid. Each grid square represents one unit on both the x and y axes. The text 'I bap' is written above the graphs, but it is not part of the mathematical data.
Graph 1 (Left):
- The graph starts at approximately \( x = -1.5 \), \( y = -2 \).
- It rises linearly to \( x = 0 \), \( y = 0 \).
- It continues to rise linearly to a peak at \( x = 3 \), \( y = 1 \).
- From \( x = 3 \), \( y = 1 \), the graph decreases linearly to \( x = 4 \), \( y = -3 \).
- The graph ends at approximately \( x = 4.2 \), \( y = -3 \).
Graph 2 (Right):
- The graph starts at \( x = 0 \), \( y = 0 \).
- It rises to a peak at approximately \( x = 1.5 \), \( y = 3 \).
- It then decreases linearly to \( x = 5 \), \( y = 1 \).
- From \( x = 5 \), \( y = 1 \), the graph increases sharply to \( x = 6 \), \( y = 4 \).
- It then decreases sharply to approximately \( x = 7.2 \), \( y = 0 \).
Summary of Key Points:
Graph 1: \( (-1.5, -2), (0, 0), (3, 1), (4, -3) \)
Graph 2: \( (0, 0), (1.5, 3), (5, 1), (6, 4), (7.2, 0) \)
