
 Алгебра
 Английский
 Биология
 География
 Геометрия
 История
 Русский
 Обществознание
 Физика
 Химия
Химия Информатика
 Литература
 Математика
Вопрос:
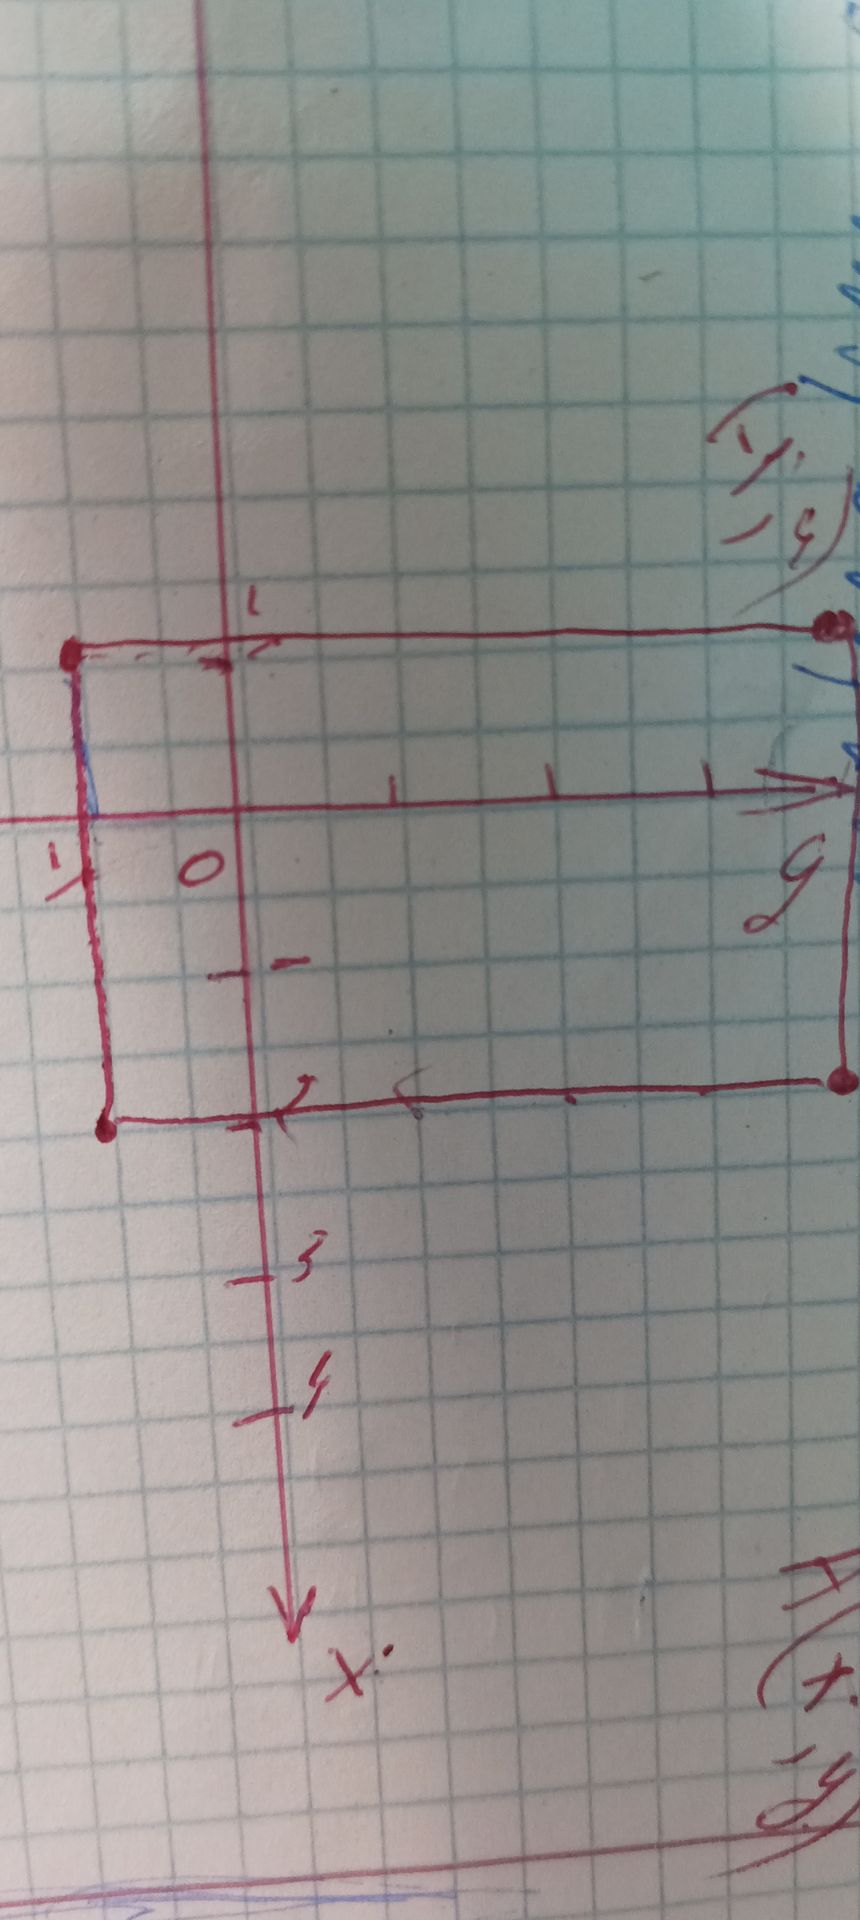
Analyze the image and provide the coordinates of the points plotted on the Cartesian plane.
Ответ:
Analysis of the Cartesian Plane:
The image displays a Cartesian coordinate system with axes and plotted points. Based on the grid lines and markings, we can determine the coordinates of the visible points.
- The origin (0,0) is clearly marked.
- The positive x-axis has markings at 1 and 2.
- The positive y-axis has markings at 1 and 2.
- The negative y-axis has markings at -1, -2, -3, and -4.
Plotted Points:
- There is a point plotted at the intersection of the line segment starting from y=-1 and extending to the right, and the line segment starting from x=0 and extending downwards. This point appears to be at (0, -1).
- There is a point plotted at the intersection of the line segment starting from y=-3 and extending to the right, and the line segment starting from x=0 and extending downwards. This point appears to be at (0, -3).
- There is a point plotted at the intersection of the line segment starting from y=1 and extending to the right, and the line segment starting from x=0 and extending upwards. This point appears to be at (0, 1).
- There is a point plotted at the intersection of the horizontal line segment from x=0 to approximately x=2 and the vertical line at y=1. This point is at (2, 1).
- There is a point plotted at the intersection of the horizontal line segment from x=0 to approximately x=2 and the vertical line at y=-3. This point is at (2, -3).
Note: The exact x-coordinates for the points on the y-axis are inferred from the grid. The x-coordinates for the points on the horizontal lines are also inferred from the grid, assuming the grid squares represent unit increments.
Coordinates: (0, -1), (0, -3), (0, 1), (2, 1), (2, -3).
