
 Алгебра
 Английский
 Биология
 География
 Геометрия
 История
 Русский
 Обществознание
 Физика
 Химия
Химия Информатика
 Литература
 Математика
Analyze the provided image and extract information about the population characteristics of Russian republics and their corresponding administrative divisions on the map.
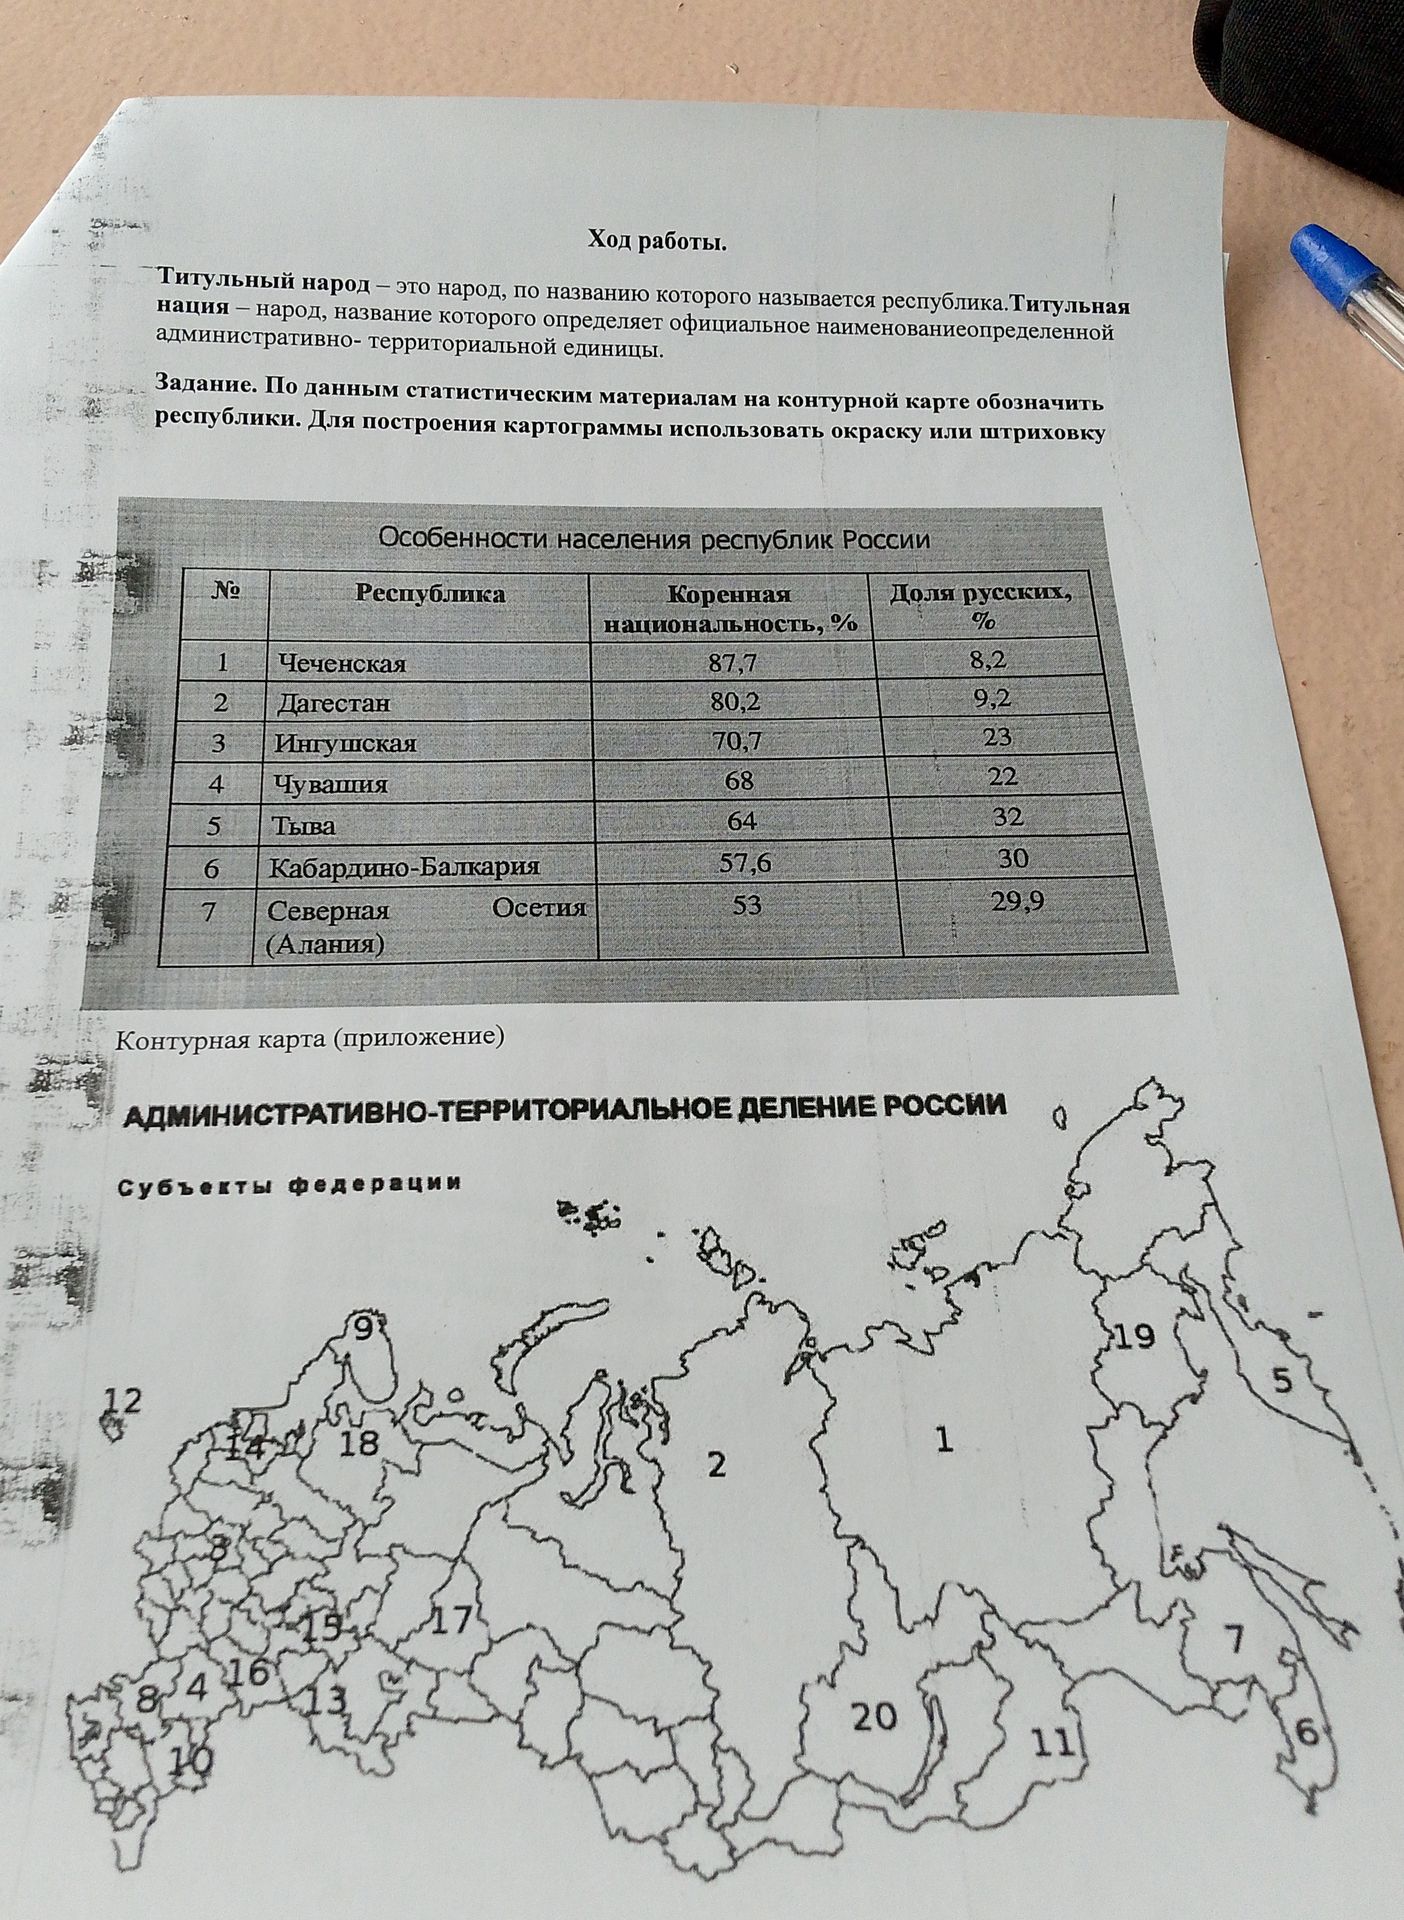
Ответ:
Особенности населения республик России
| № | Республика | Коренная национальность, % | Доля русских, % |
|---|---|---|---|
| 1 | Чеченская | 87,7 | 8,2 |
| 2 | Дагестан | 80,2 | 9,2 |
| 3 | Ингушская | 70,7 | 23 |
| 4 | Чувашия | 68 | 22 |
| 5 | Тыва | 64 | 32 |
| 6 | Кабардино-Балкария | 57,6 | 30 |
| 7 | Северная Осетия (Алания) | 53 | 29,9 |
АДМИНИСТРАТИВНО-ТЕРРИТОРИАЛЬНОЕ ДЕЛЕНИЕ РОССИИ
The provided image contains a table with data on the population characteristics of some Russian republics, including the percentage of the indigenous nationality and the percentage of Russians. It also shows a contour map of Russia with numbered regions, which are intended to be labeled according to the statistical data. The task is to use the statistical data to mark the republics on the map using coloring or hatching.
Table Data:
- 1. Chechen Republic: Indigenous nationality - 87.7%, Russians - 8.2%
- 2. Dagestan: Indigenous nationality - 80.2%, Russians - 9.2%
- 3. Ingushetia: Indigenous nationality - 70.7%, Russians - 23%
- 4. Chuvashia: Indigenous nationality - 68%, Russians - 22%
- 5. Tyva: Indigenous nationality - 64%, Russians - 32%
- 6. Kabardino-Balkaria: Indigenous nationality - 57.6%, Russians - 30%
- 7. North Ossetia (Alania): Indigenous nationality - 53%, Russians - 29.9%
The map shows numbered regions, but without a key or further information in the image, it's impossible to definitively match each number to a specific republic from the table. For example, region '1' is a very large central area, region '2' is in Siberia, and '19' is in the Far East.
To complete the task described in the image, one would need to:
- Identify the geographical location of each republic listed in the table on a more detailed map.
- Match these republics to the corresponding numbered regions on the provided contour map.
- Apply distinct coloring or hatching to each region on the map based on the provided data (e.g., by percentage of indigenous nationality or percentage of Russians).
Since this is an image analysis task, I can only extract the data and describe the visual elements. The actual mapping and coloring cannot be performed within this format.
