
 Алгебра
 Английский
 Биология
 География
 Геометрия
 История
 Русский
 Обществознание
 Физика
 Химия
Химия Информатика
 Литература
 Математика
Вопрос:
Analyze the provided image of a Cartesian coordinate system.
Ответ:
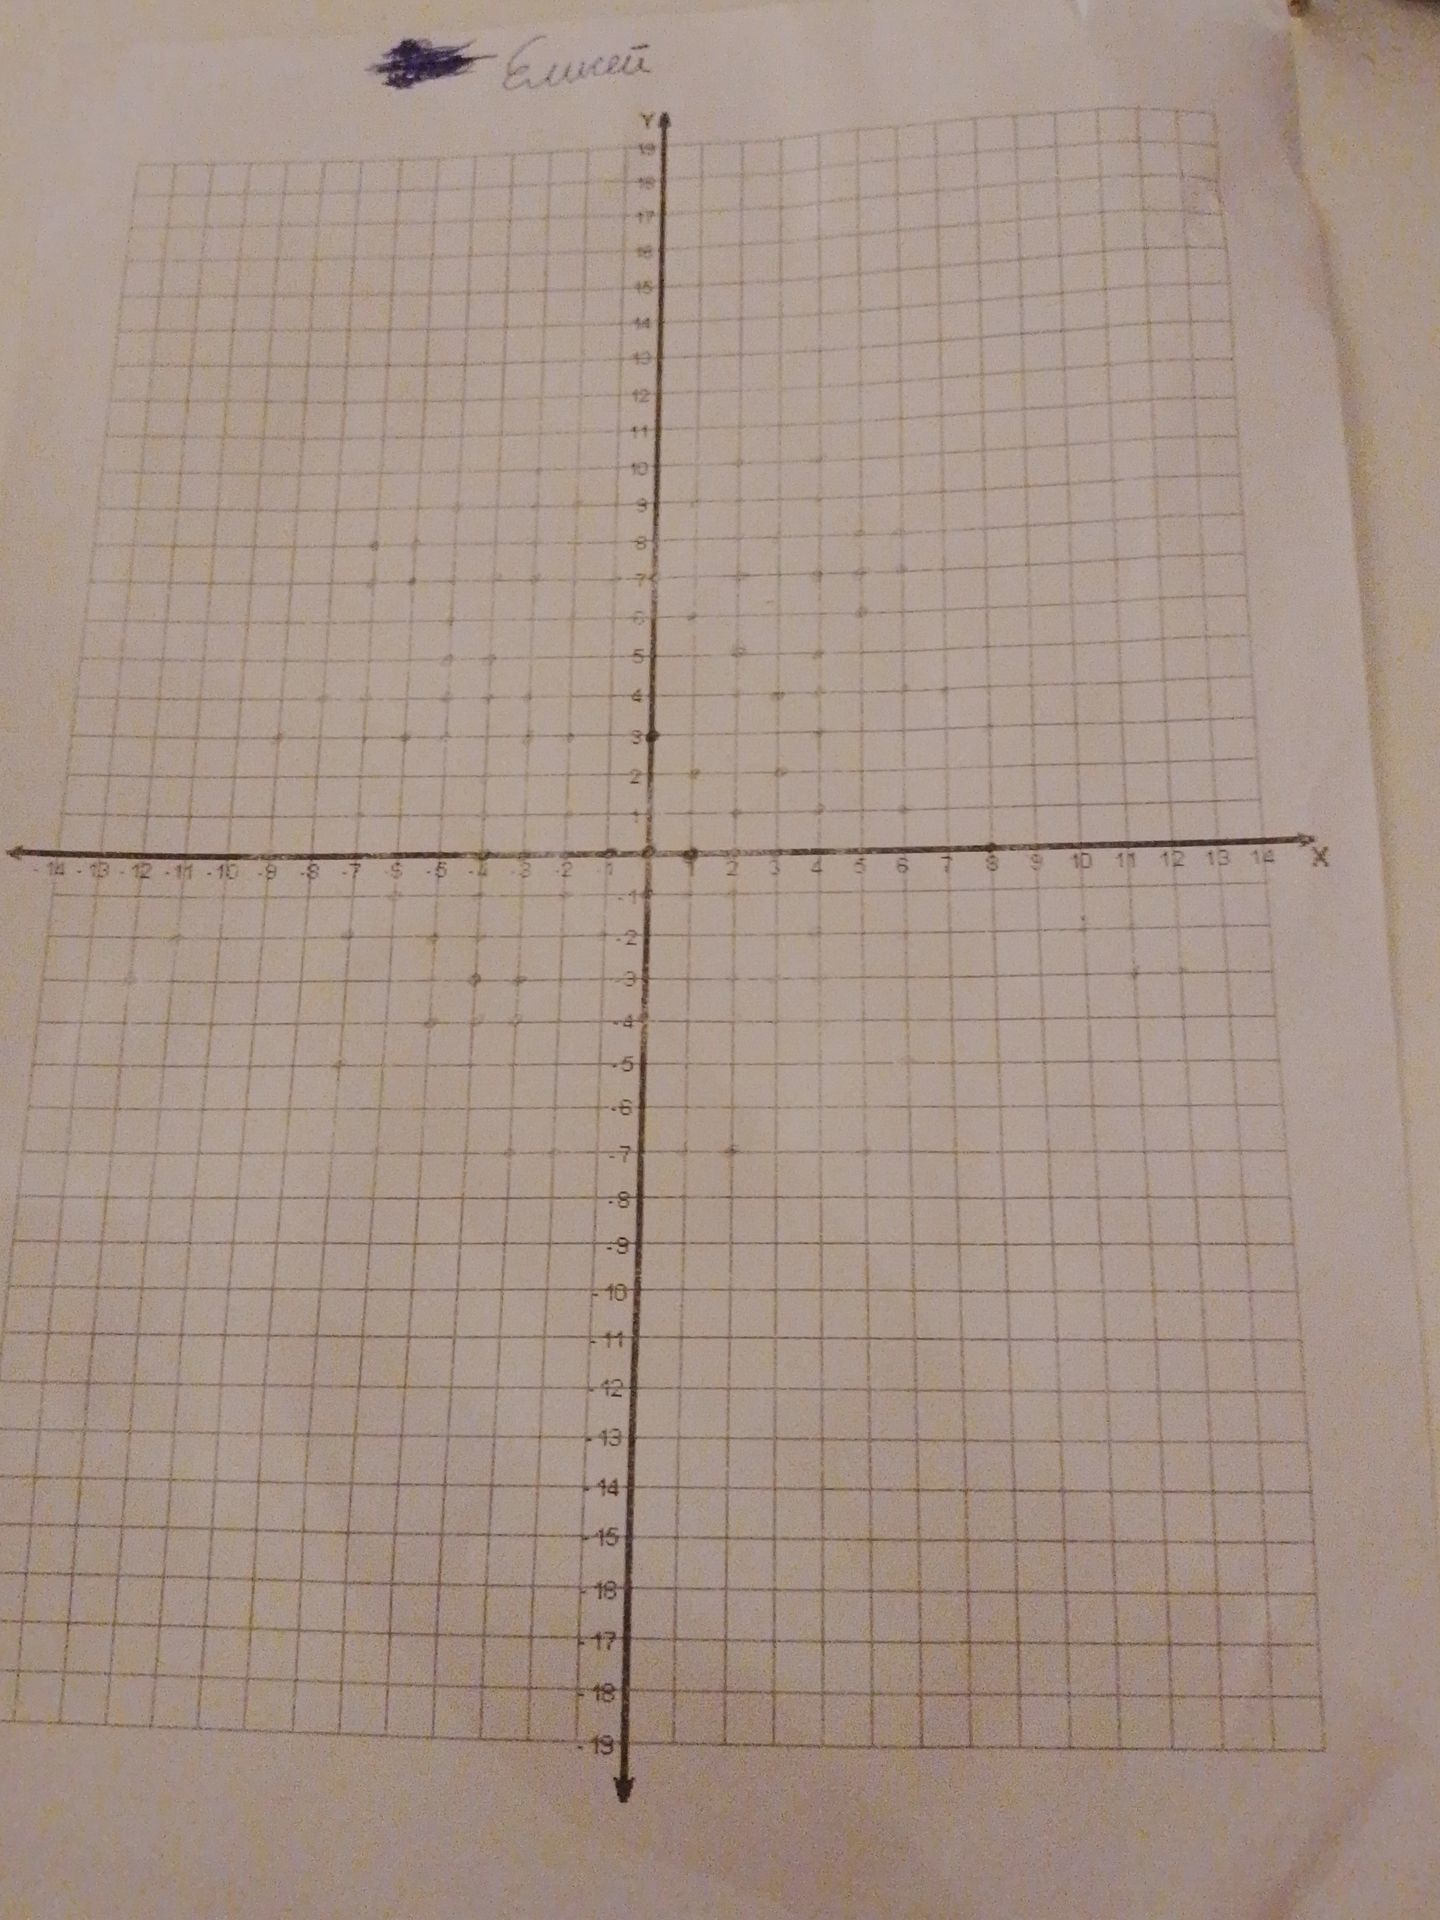
Analysis of the Cartesian Coordinate System Image
The image displays a standard Cartesian coordinate system with the x-axis and y-axis intersecting at the origin (0,0).
Axes Labels:
- The horizontal axis is labeled as 'X'.
- The vertical axis is labeled as 'Y'.
Scale and Grid:
- The grid lines represent units along both axes.
- The x-axis is marked with integer values from -14 to 14.
- The y-axis is marked with integer values from -19 to 19.
Plotted Points:
Several points appear to be plotted on the graph. Based on visual inspection, their approximate coordinates are:
- Point 1: Approximately (1, 3)
- Point 2: Approximately (4, 5)
- Point 3: Approximately (6, 2)
- Point 4: Approximately (-3, -4)
- Point 5: Approximately (-7, -8)
- Point 6: Approximately (-10, -6)
- Point 7: Approximately (-12, -2)
- Point 8: Approximately (-14, 0)
- Point 9: Approximately (1, 0)
Additional Text:
There is handwritten text at the top left corner of the image that appears to be a name, 'Елисей' (Elisei).
