
 Алгебра
 Английский
 Биология
 География
 Геометрия
 История
 Русский
 Обществознание
 Физика
 Химия
Химия Информатика
 Литература
 Математика
Вопрос:
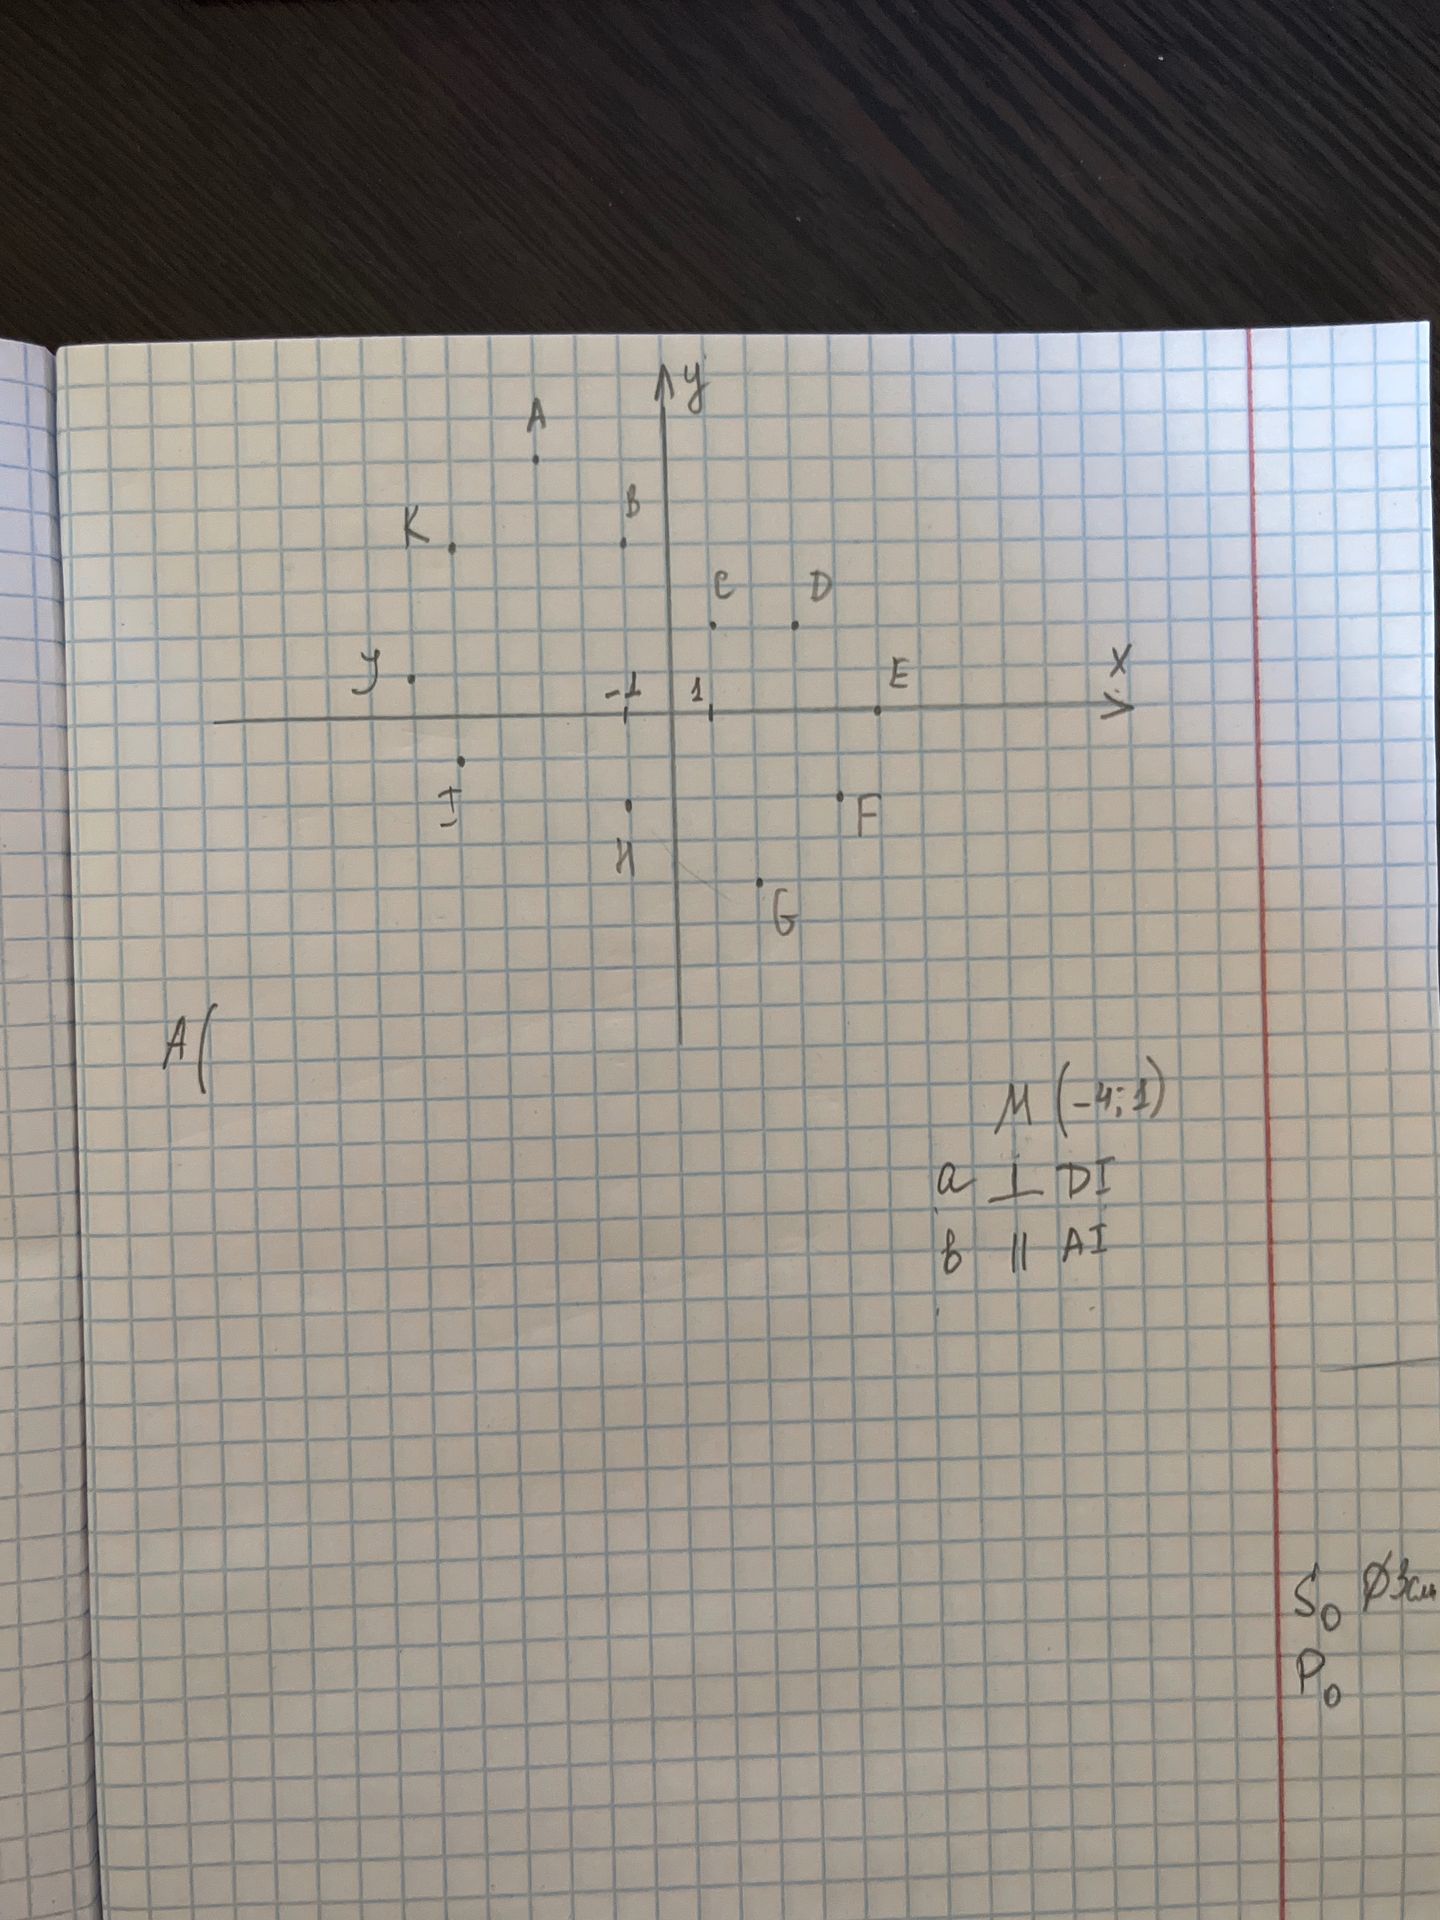
Analyze the provided image of a Cartesian coordinate system with labeled points and mathematical expressions.
Ответ:
Analysis of the Cartesian Coordinate System
The image displays a Cartesian coordinate system with the x-axis labeled as 'x' and the y-axis labeled as 'y'. Several points are marked on the graph, and some mathematical expressions are present.
Labeled Points:
- Points are labeled with uppercase and lowercase letters: A, B, C, D, E, F, G, H, I, J, K.
- Some points appear to be at integer coordinates. For example, a point near the origin could be (0,0).
- Point 'B' seems to be on the y-axis at approximately y=1.
- Point 'E' seems to be on the x-axis at approximately x=2.
- Point 'K' is located in the second quadrant.
- Point 'J' is located in the third quadrant.
- Point 'H' is located in the fourth quadrant.
Mathematical Expressions and Notation:
- The point M is given with coordinates M (-4; 1). Note the use of a semicolon as a coordinate separator.
- There are two statements regarding lines or vectors labeled 'a' and 'b':
- a ⊥ DI: This likely signifies that line 'a' is perpendicular to line segment 'DI'.
- b || AI: This likely signifies that line 'b' is parallel to line segment 'AI'.
- There are also notations S0 and P0 on the right side of the image, which could represent initial conditions or specific parameters in a problem.
- The expression A( is partially written on the left side, suggesting the start of defining coordinates for point A.
Grid:
The graph paper has a grid, facilitating the estimation of coordinates for the plotted points. The grid lines are spaced at regular intervals, likely representing units on the axes.
