
 Алгебра
 Английский
 Биология
 География
 Геометрия
 История
 Русский
 Обществознание
 Физика
 Химия
Химия Информатика
 Литература
 Математика
Вопрос:
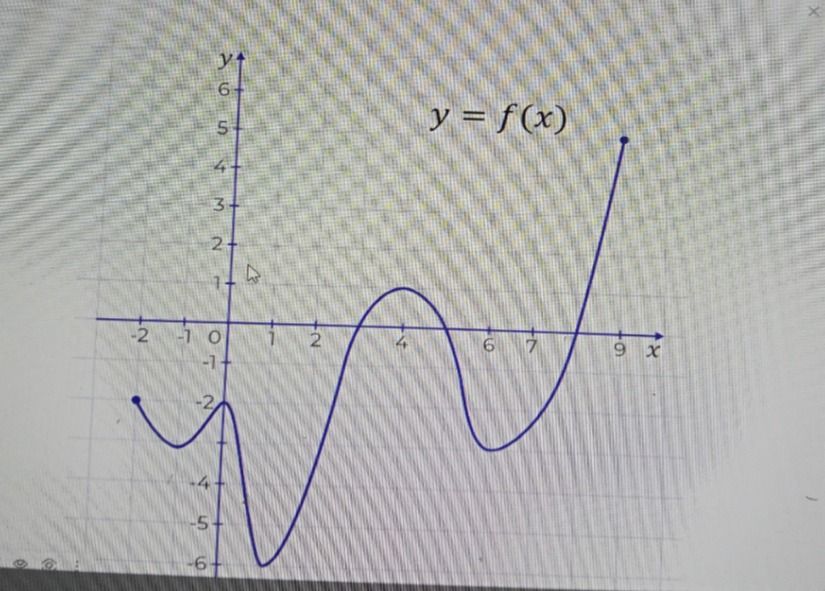
Based on the provided image, describe the behavior of the function $$y=f(x)$$.
Ответ:
Analysis of the function $$y=f(x)$$
The graph shows a function $$y=f(x)$$ with several key features:
- Local Extrema: There appear to be two local maxima and two local minima. One local maximum is around $$x=4$$, and another is at the right end of the visible graph. There are local minima around $$x=1$$ and $$x=6$$.
- Roots (x-intercepts): The function crosses the x-axis at approximately $$x=2.5$$, $$x=5$$, and $$x=8$$.
- Y-intercept: The function crosses the y-axis at approximately $$y=-1.5$$.
- End Behavior: As $$x$$ approaches positive infinity, $$f(x)$$ appears to increase without bound. As $$x$$ approaches negative infinity, $$f(x)$$ appears to decrease without bound.
- Points of Interest:
- At $$x=-2$$, $$f(x) ≈ -1.7$$.
- At $$x=0$$, $$f(x) ≈ -1.5$$.
- At $$x ≈ 1$$, there is a local minimum.
- At $$x ≈ 4$$, there is a local maximum.
- At $$x ≈ 6$$, there is a local minimum.
- At $$x=9$$, $$f(x) ≈ 5$$.
Overall, the graph represents a continuous function, likely a polynomial of degree 5 or higher, given the number of turning points.
Answer: The function $$y=f(x)$$ exhibits multiple local extrema, crosses the x-axis at approximately $$x=2.5, 5, 8$$, has a y-intercept near $$-1.5$$, and increases indefinitely as $$x$$ goes to positive infinity while decreasing indefinitely as $$x$$ goes to negative infinity.
