
 Алгебра
 Английский
 Биология
 География
 Геометрия
 История
 Русский
 Обществознание
 Физика
 Химия
Химия Информатика
 Литература
 Математика
Вопрос:
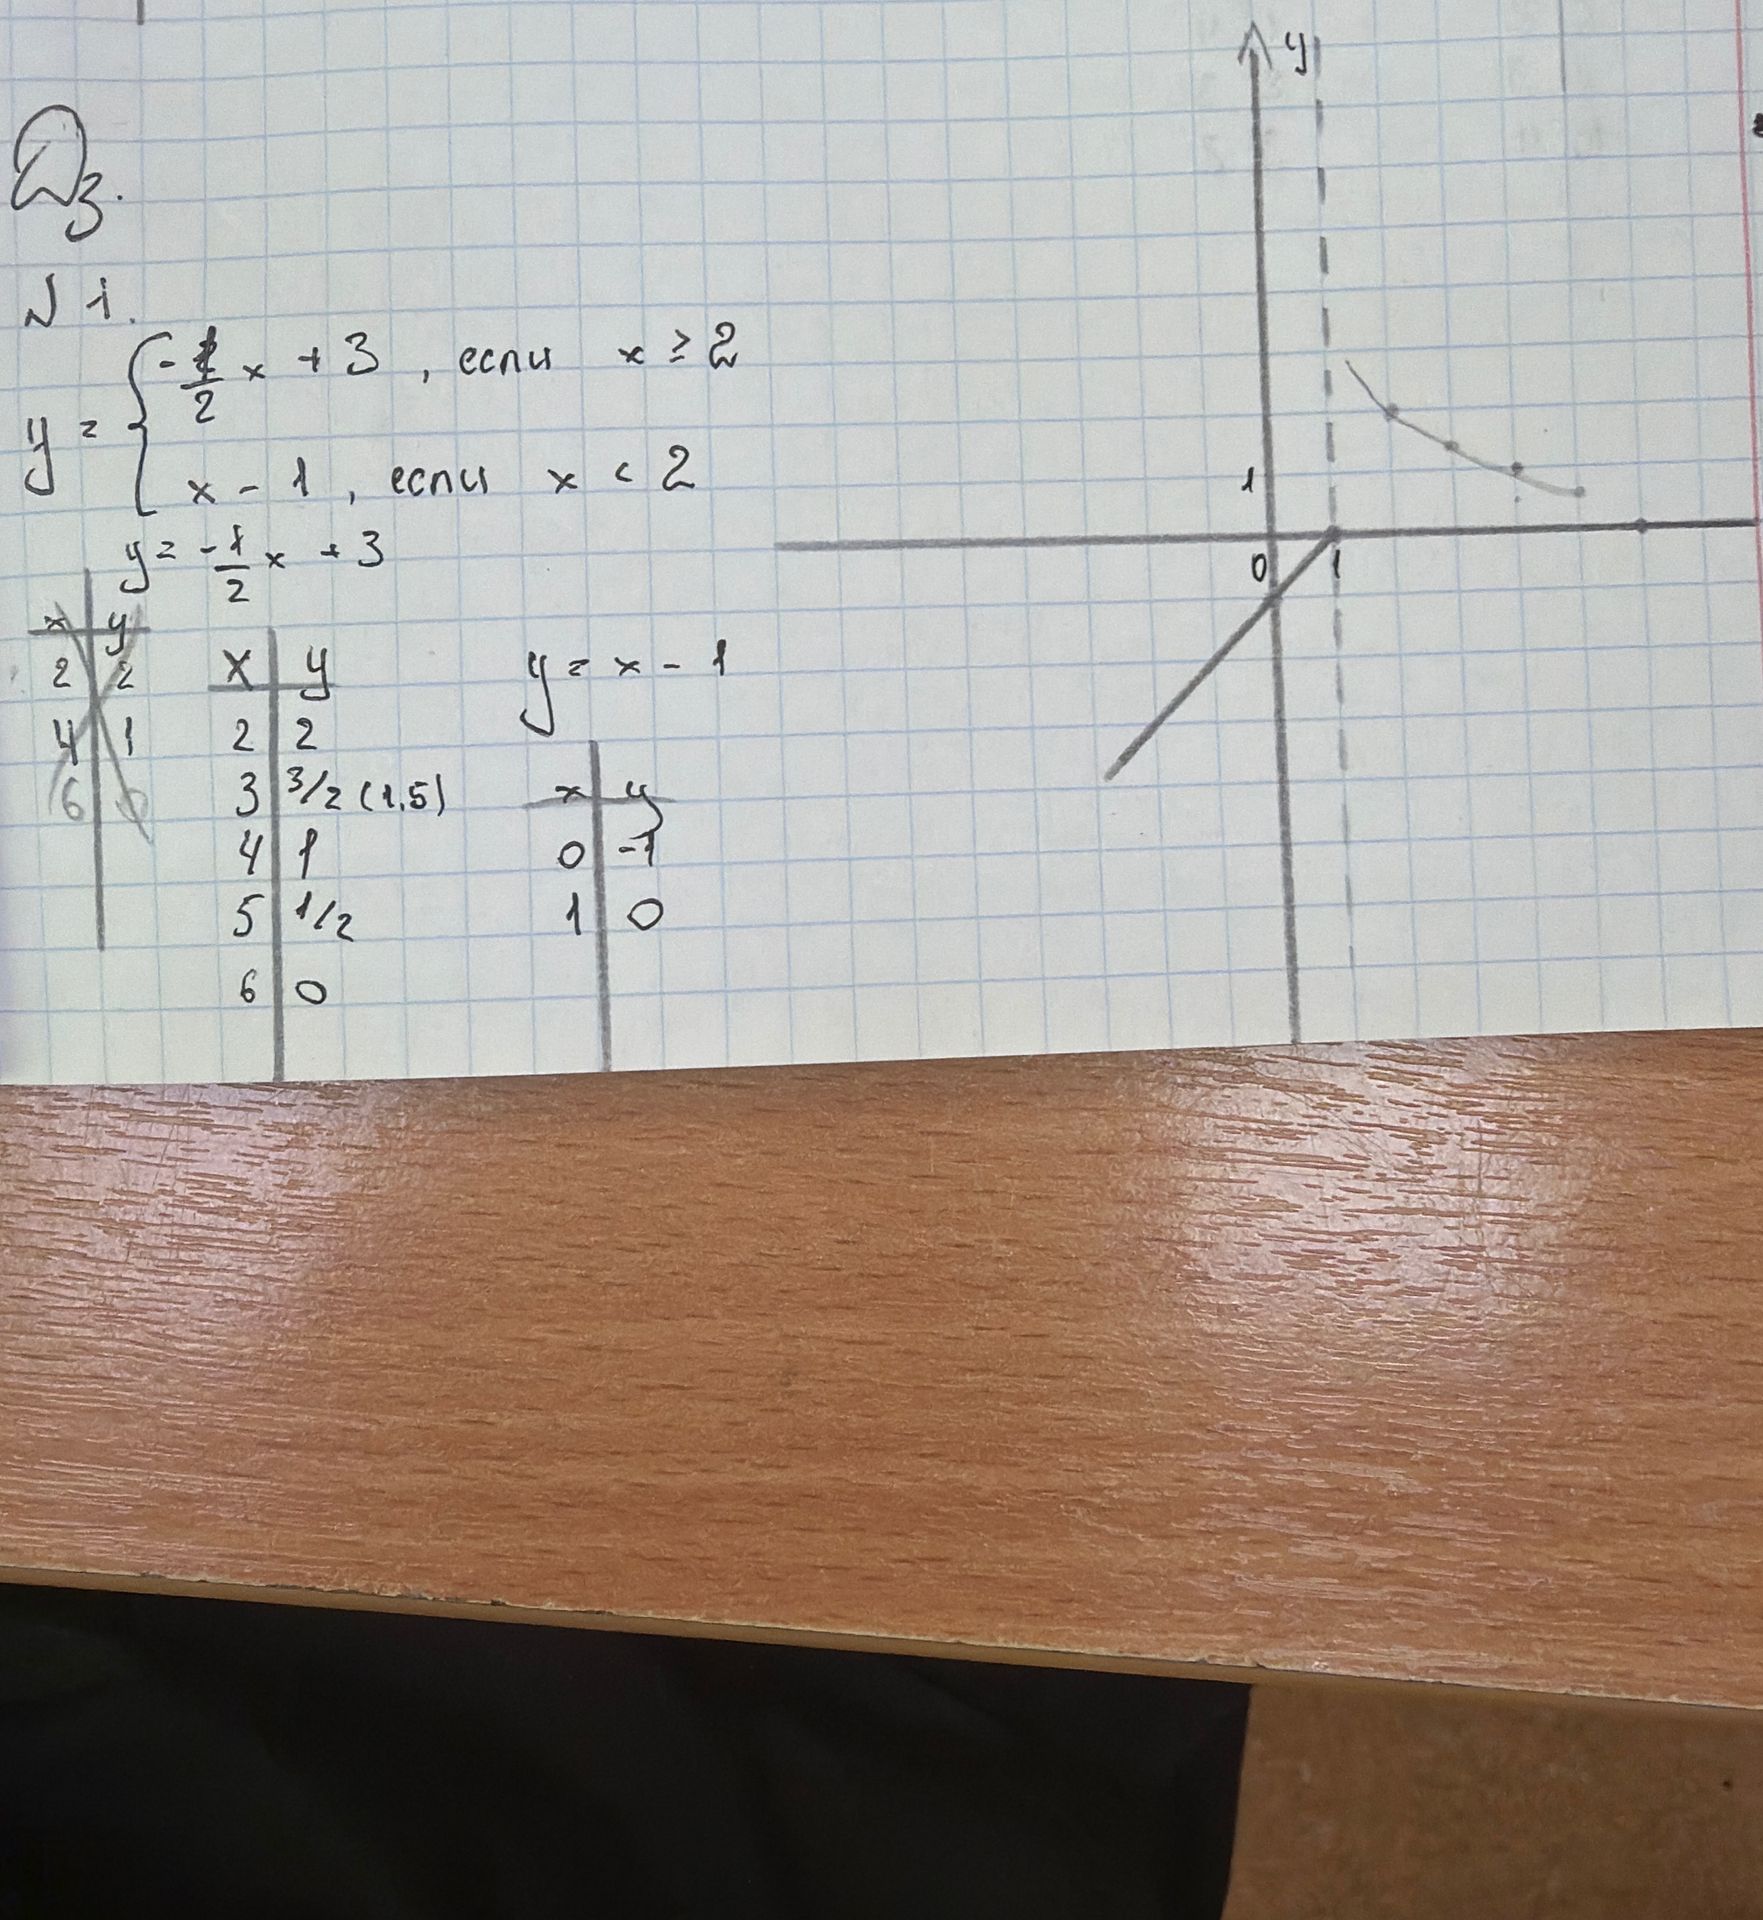
Determine the function graphed in the image.
Ответ:
Solution:
The image displays a piecewise function and its graph. We need to determine the function definitions for each part.
The function is defined as:
- \( y = -\frac{1}{2}x + 3 \) for \( x \ge 2 \)
- \( y = x - 1 \) for \( x < 2 \)
This can be represented as:
$$ y = \begin{cases} -\frac{1}{2}x + 3, & \text{if } x \ge 2 \\ x - 1, & \text{if } x < 2 \end{cases} $$
Let's verify the points on the graph:
- For \( x = 2 \), the first part of the function gives \( y = -\frac{1}{2}(2) + 3 = -1 + 3 = 2 \). The point \( (2, 2) \) is plotted.
- For \( x = 4 \), the first part gives \( y = -\frac{1}{2}(4) + 3 = -2 + 3 = 1 \). The point \( (4, 1) \) is plotted.
- For \( x = 0 \), the second part gives \( y = 0 - 1 = -1 \). The point \( (0, -1) \) is plotted.
- For \( x = 1 \), the second part gives \( y = 1 - 1 = 0 \). The point \( (1, 0) \) is plotted.
The tables provided also represent these functions:
| x | y |
|---|---|
| 2 | 2 |
| 4 | 1 |
| 6 | 0 |
| x | y |
|---|---|
| 0 | -1 |
| 1 | 0 |
| 2 | 1 |
| 3 | 2 |
| 4 | 3 |
| 5 | 4 |
| 6 | 5 |
The graph visually confirms the behavior of these two linear functions meeting at \( x=2 \).
Answer: The function is defined by \( y = -\frac{1}{2}x + 3 \) for \( x \ge 2 \) and \( y = x - 1 \) for \( x < 2 \).
