
 Алгебра
 Английский
 Биология
 География
 Геометрия
 История
 Русский
 Обществознание
 Физика
 Химия
Химия Информатика
 Литература
 Математика
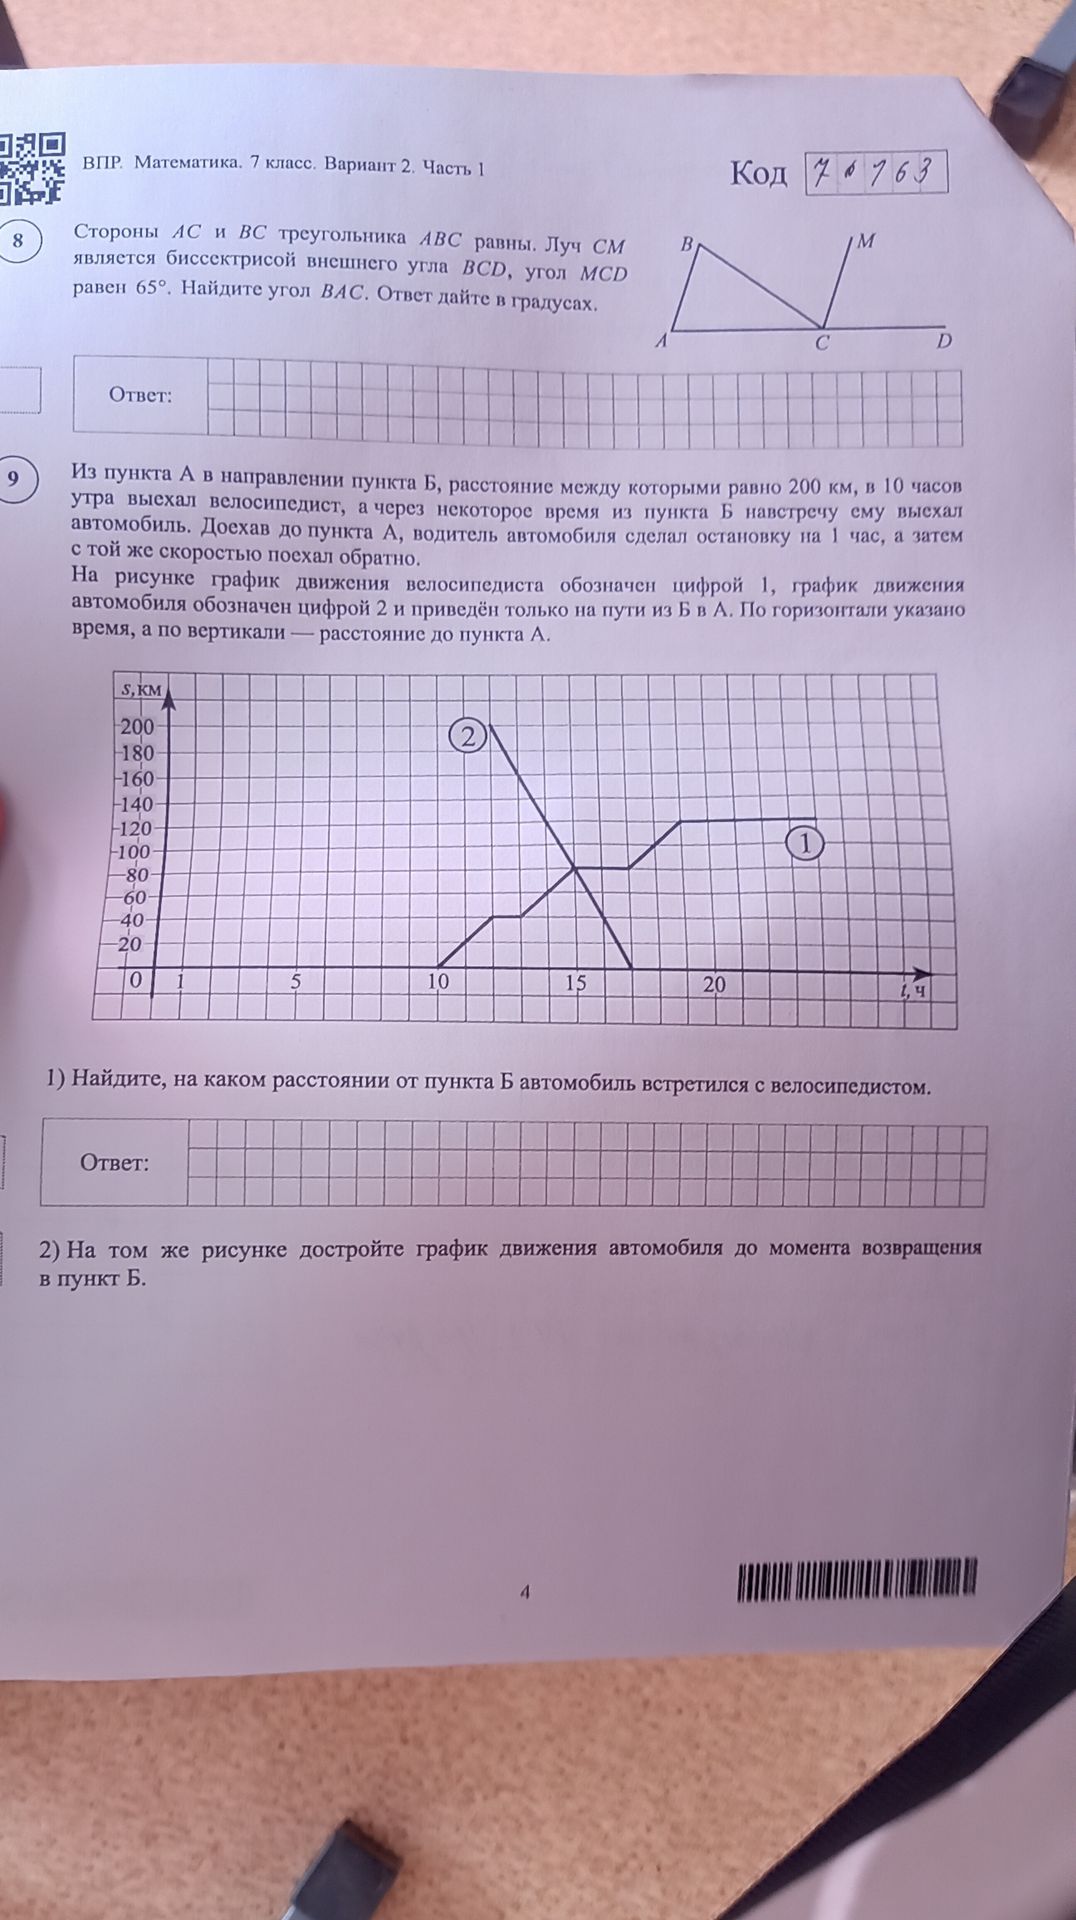
From point A in the direction of point B, the distance between which is 200 km, a cyclist left at 10 o'clock in the morning, and after some time, a car left from point B towards him. Having reached point A, the car driver stopped for 1 hour, and then drove back at the same speed. The graph shows the movement of the cyclist is denoted by the number 1, the graph of the movement of the car is denoted by the number 2 and is shown only on the way from B to A. Time is indicated horizontally, and distance to point A is indicated vertically. 1) Find at what distance from point B the car met the cyclist. Answer: 2) In the same drawing, complete the graph of the car's movement until it returns to point B.
Ответ:
Analysis of the graph:
The graph shows the distance from point A. The total distance between A and B is 200 km.
Graph 1 (Cyclist):
- Starts at point A (distance 0) at 10:00.
- Reaches point B (distance 200 km) at some point.
- The cyclist's speed can be calculated from the graph. For example, at 15 hours, the cyclist is at a distance of 150 km from A. So, the speed of the cyclist is:
\[ v_{cyclist} = \frac{\text{distance}}{\text{time}} = \frac{150 \text{ km}}{15 \text{ h} - 10 \text{ h}} = \frac{150 \text{ km}}{5 \text{ h}} = 30 \text{ km/h} \]
Graph 2 (Car):
- Starts at point B (distance 200 km from A) at some time.
- Reaches point A (distance 0 km from A) after a certain time, with a stop.
- The graph shows that the car reaches point A at 15 hours. So, the time taken to travel from B to A is 15 h - (start time of car).
- The distance traveled by the car from B to A is 200 km.
- The car stops at point A from 15 hours to 16 hours (1 hour stop).
1) Finding the meeting point:
The meeting point is where the two graphs intersect. This occurs at approximately 13.5 hours.
Let's find the position of the cyclist at 13.5 hours:
\[ \text{Distance of cyclist from A} = 10 \text{ h} + (13.5 \text{ h} - 10 \text{ h}) \times 30 \text{ km/h} = 0 + 3.5 \text{ h} \times 30 \text{ km/h} = 105 \text{ km} \]
Let's find the position of the car at 13.5 hours. The car starts from B at some time and reaches A at 15 hours. From the graph, it appears the car starts around 11 hours.
Time taken by car to travel from B to A = 15 h - 11 h = 4 hours.
Speed of the car = \( \frac{200 \text{ km}}{4 \text{ h}} = 50 \text{ km/h} \).
At 13.5 hours, the car has been traveling for 13.5 h - 11 h = 2.5 hours.
\[ \text{Distance of car from A} = 200 \text{ km} - (2.5 \text{ h} \times 50 \text{ km/h}) = 200 \text{ km} - 125 \text{ km} = 75 \text{ km} \]
The intersection point on the graph is at approximately 13.5 hours, with a distance of 105 km for the cyclist and 75 km for the car. There seems to be a discrepancy. Let's re-examine the graph carefully.
The cyclist's graph (1) shows points at (10, 0), (15, 150), (20, 200). This means the cyclist's speed is \( \frac{150}{15-10} = 30 \text{ km/h} \) for the first 5 hours, and then \( \frac{50}{20-15} = 10 \text{ km/h} \) for the next 5 hours. This is inconsistent with the problem description where the cyclist travels from A to B.
Let's assume the graph for the cyclist (1) is correct as given, and the problem statement is to interpret it.
Cyclist's journey (graph 1):
- From 10h to 15h: travels 150 km from A. Speed = 150 km / 5 h = 30 km/h.
- From 15h to 20h: travels from 150 km to 200 km from A. Speed = 50 km / 5 h = 10 km/h.
Car's journey (graph 2, from B to A):
- Starts from B (200 km from A).
- Reaches A (0 km from A) at 15h.
- Stops from 15h to 16h.
- From the graph, the car starts at 11h. So, it travels 200 km in 4 hours (from 11h to 15h).
- Speed of car = 200 km / 4 h = 50 km/h.
Meeting point:
We need to find the time 't' when the distance from A for both is the same.
Cyclist's position: \( S_{cyclist}(t) \)
- For \( 10 ≤ t ≤ 15 \): \( S_{cyclist}(t) = 30(t-10) \)
- For \( 15 < t ≤ 20 \): \( S_{cyclist}(t) = 150 + 10(t-15) \)
Car's position: \( S_{car}(t) \)
- For \( 11 ≤ t ≤ 15 \): \( S_{car}(t) = 200 - 50(t-11) \)
We are looking for the intersection of \( S_{cyclist}(t) \) and \( S_{car}(t) \) in the interval \( 11 ≤ t ≤ 15 \).
Set \( 30(t-10) = 200 - 50(t-11) \)
\[ 30t - 300 = 200 - 50t + 550 \]
\[ 30t - 300 = 750 - 50t \]
\[ 80t = 1050 \]
\[ t = \frac{1050}{80} = \frac{105}{8} = 13.125 \text{ hours} \]
Now, find the distance from A at this time:
\[ S_{cyclist}(13.125) = 30(13.125 - 10) = 30(3.125) = 93.75 \text{ km} \]
Let's check with the car's position:
\[ S_{car}(13.125) = 200 - 50(13.125 - 11) = 200 - 50(2.125) = 200 - 106.25 = 93.75 \text{ km} \]
So, they meet at 13.125 hours at a distance of 93.75 km from point A.
The question asks for the distance from point B. Distance from B = Total distance - Distance from A = 200 km - 93.75 km = 106.25 km.
2) Completing the car's graph:
The car stopped at point A from 15:00 to 16:00. After the stop, it returns to point B at the same speed (50 km/h).
The car starts its return journey at 16:00.
Time to reach point B from point A = \( \frac{200 \text{ km}}{50 \text{ km/h}} = 4 \text{ hours} \).
So, the car will reach point B at 16:00 + 4 hours = 20:00.
The graph for the return journey will be a line starting from (16, 0) and ending at (20, 200).
Graph construction:
The car's movement from B to A is graph 2, which starts at some point before 10h (estimated 11h) and ends at (15, 0). Then it stops until (16, 0). From (16, 0), it moves towards B (200 km from A). The line segment for the return journey will go from (16, 0) to (20, 200).
The intersection point is at t=13.125h, S=93.75km.
Answer to question 1:
The car met the cyclist at a distance of 106.25 km from point B.
Answer to question 2:
To complete the graph, draw a line segment from the point (16, 0) to the point (20, 200).
Final Answer:
1) The car met the cyclist at a distance of 106.25 km from point B.
2) The graph for the car's return journey starts at (16, 0) and ends at (20, 200).
