
 Алгебра
 Английский
 Биология
 География
 Геометрия
 История
 Русский
 Обществознание
 Физика
 Химия
Химия Информатика
 Литература
 Математика
Вопрос:
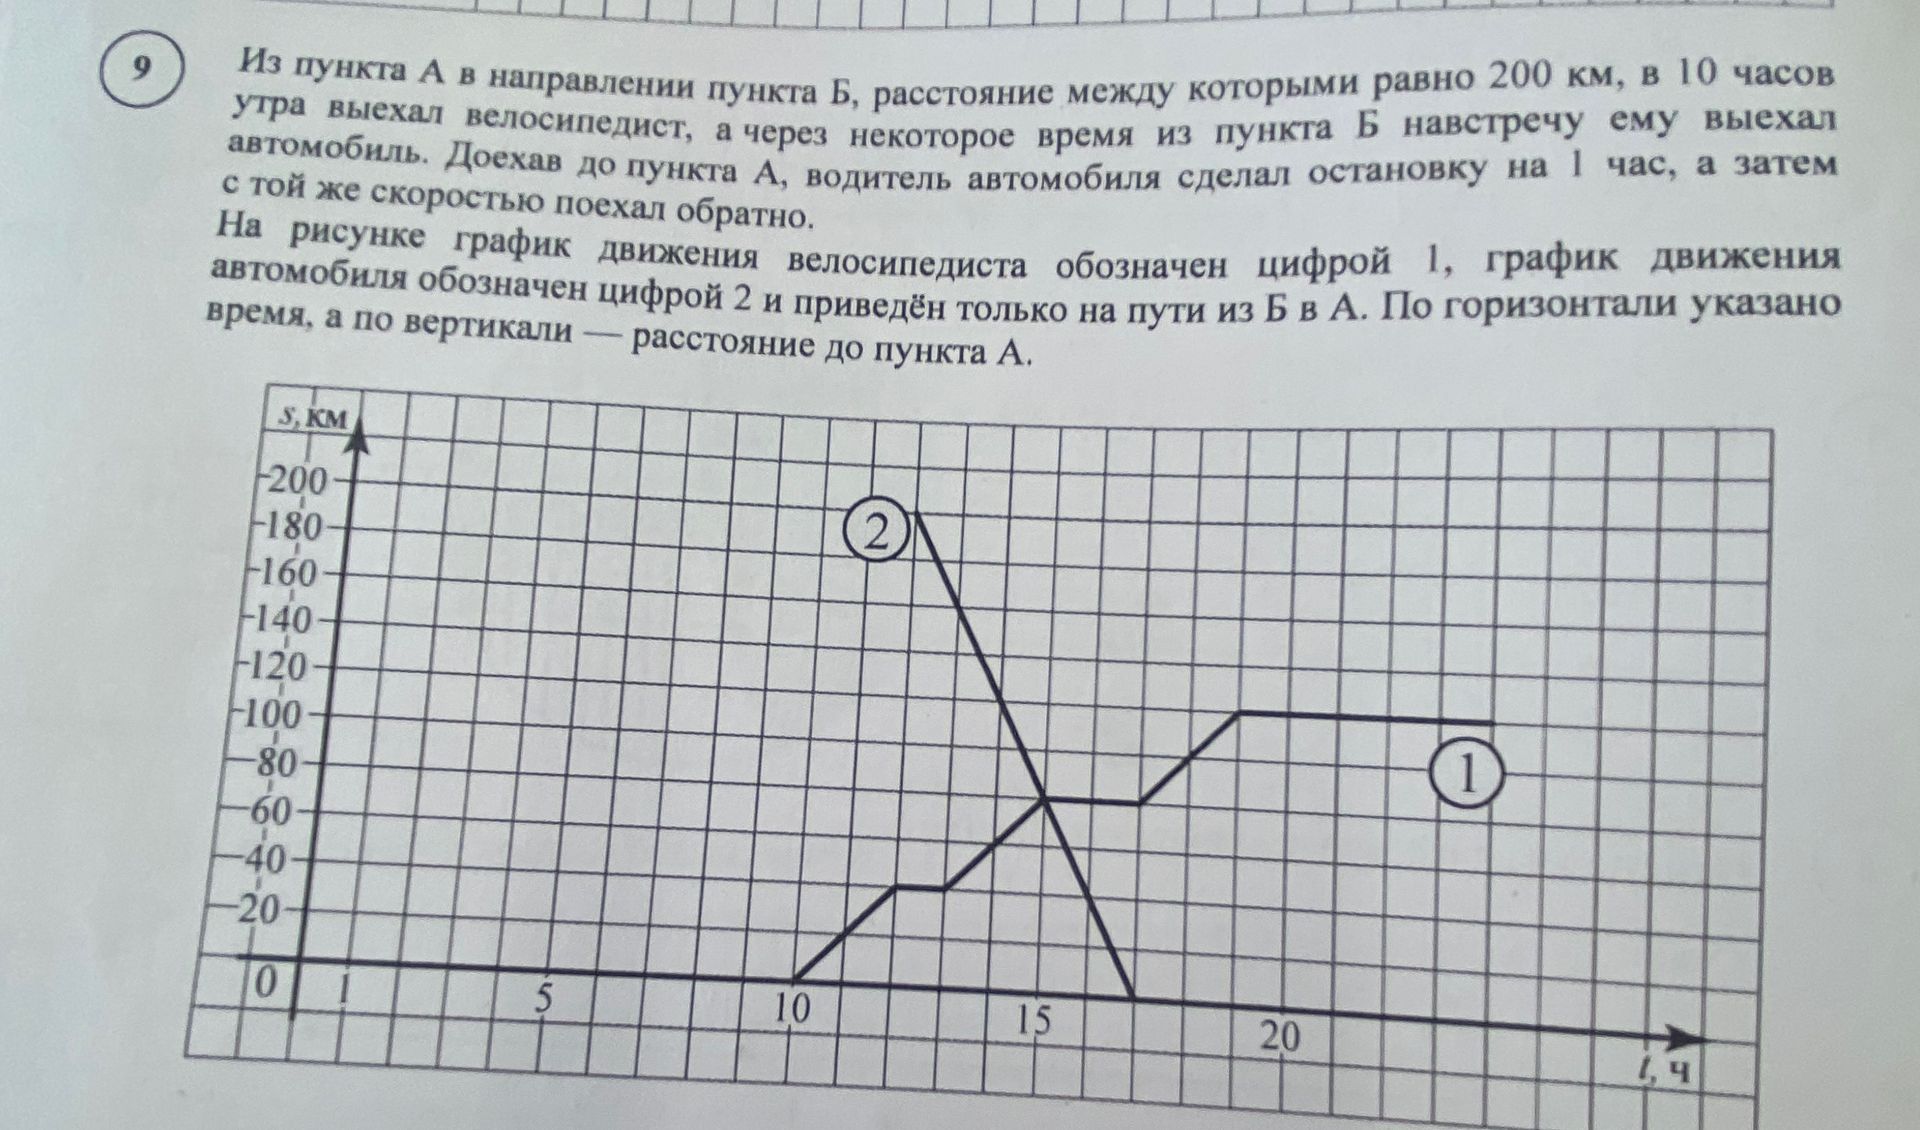
From point A in the direction of point B, the distance between which is 200 km, at 10 o'clock in the morning, a cyclist set off, and after some time from point B, a car set off towards him. Having reached point A, the car driver stopped for 1 hour, and then drove back at the same speed. In the figure, the cyclist's movement graph is denoted by the number 1, the car's movement graph is denoted by the number 2 and is shown only on the way from B to A. The horizontal axis shows time, and the vertical axis shows the distance to point A.
Ответ:
Analysis of the graph:
The graph shows the distance from point A over time for two objects.
Graph 1 (Cyclist):
- The cyclist starts at point A (distance = 0 km) at time 0.
- The cyclist moves away from A, so the distance increases.
- The graph is not fully visible, but it shows segments where the distance increases and segments where it remains constant (stops).
Graph 2 (Car):
- The car starts from point B (distance = 200 km from A) at some time after 10:00. The graph starts at time 10 on the horizontal axis.
- The car moves towards point A, so its distance from A decreases.
- The car reaches point A at approximately time 15.
- The car stops at point A for 1 hour (from time 15 to time 16, where the distance remains 0).
- After the stop, the car moves away from A (presumably back towards B, though the graph cuts off). The distance increases again.
Key points from the text and graph:
- Total distance between A and B is 200 km.
- The cyclist starts at 10:00 from A.
- The car starts from B towards A at some time after the cyclist starts.
- The car stops at A for 1 hour.
- The car returns from A at the same speed.
Without specific questions about the graph, a detailed step-by-step analysis of each segment can be provided, including calculating speeds and times for different parts of the journey.
