
 Алгебра
 Английский
 Биология
 География
 Геометрия
 История
 Русский
 Обществознание
 Физика
 Химия
Химия Информатика
 Литература
 Математика
Вопрос:
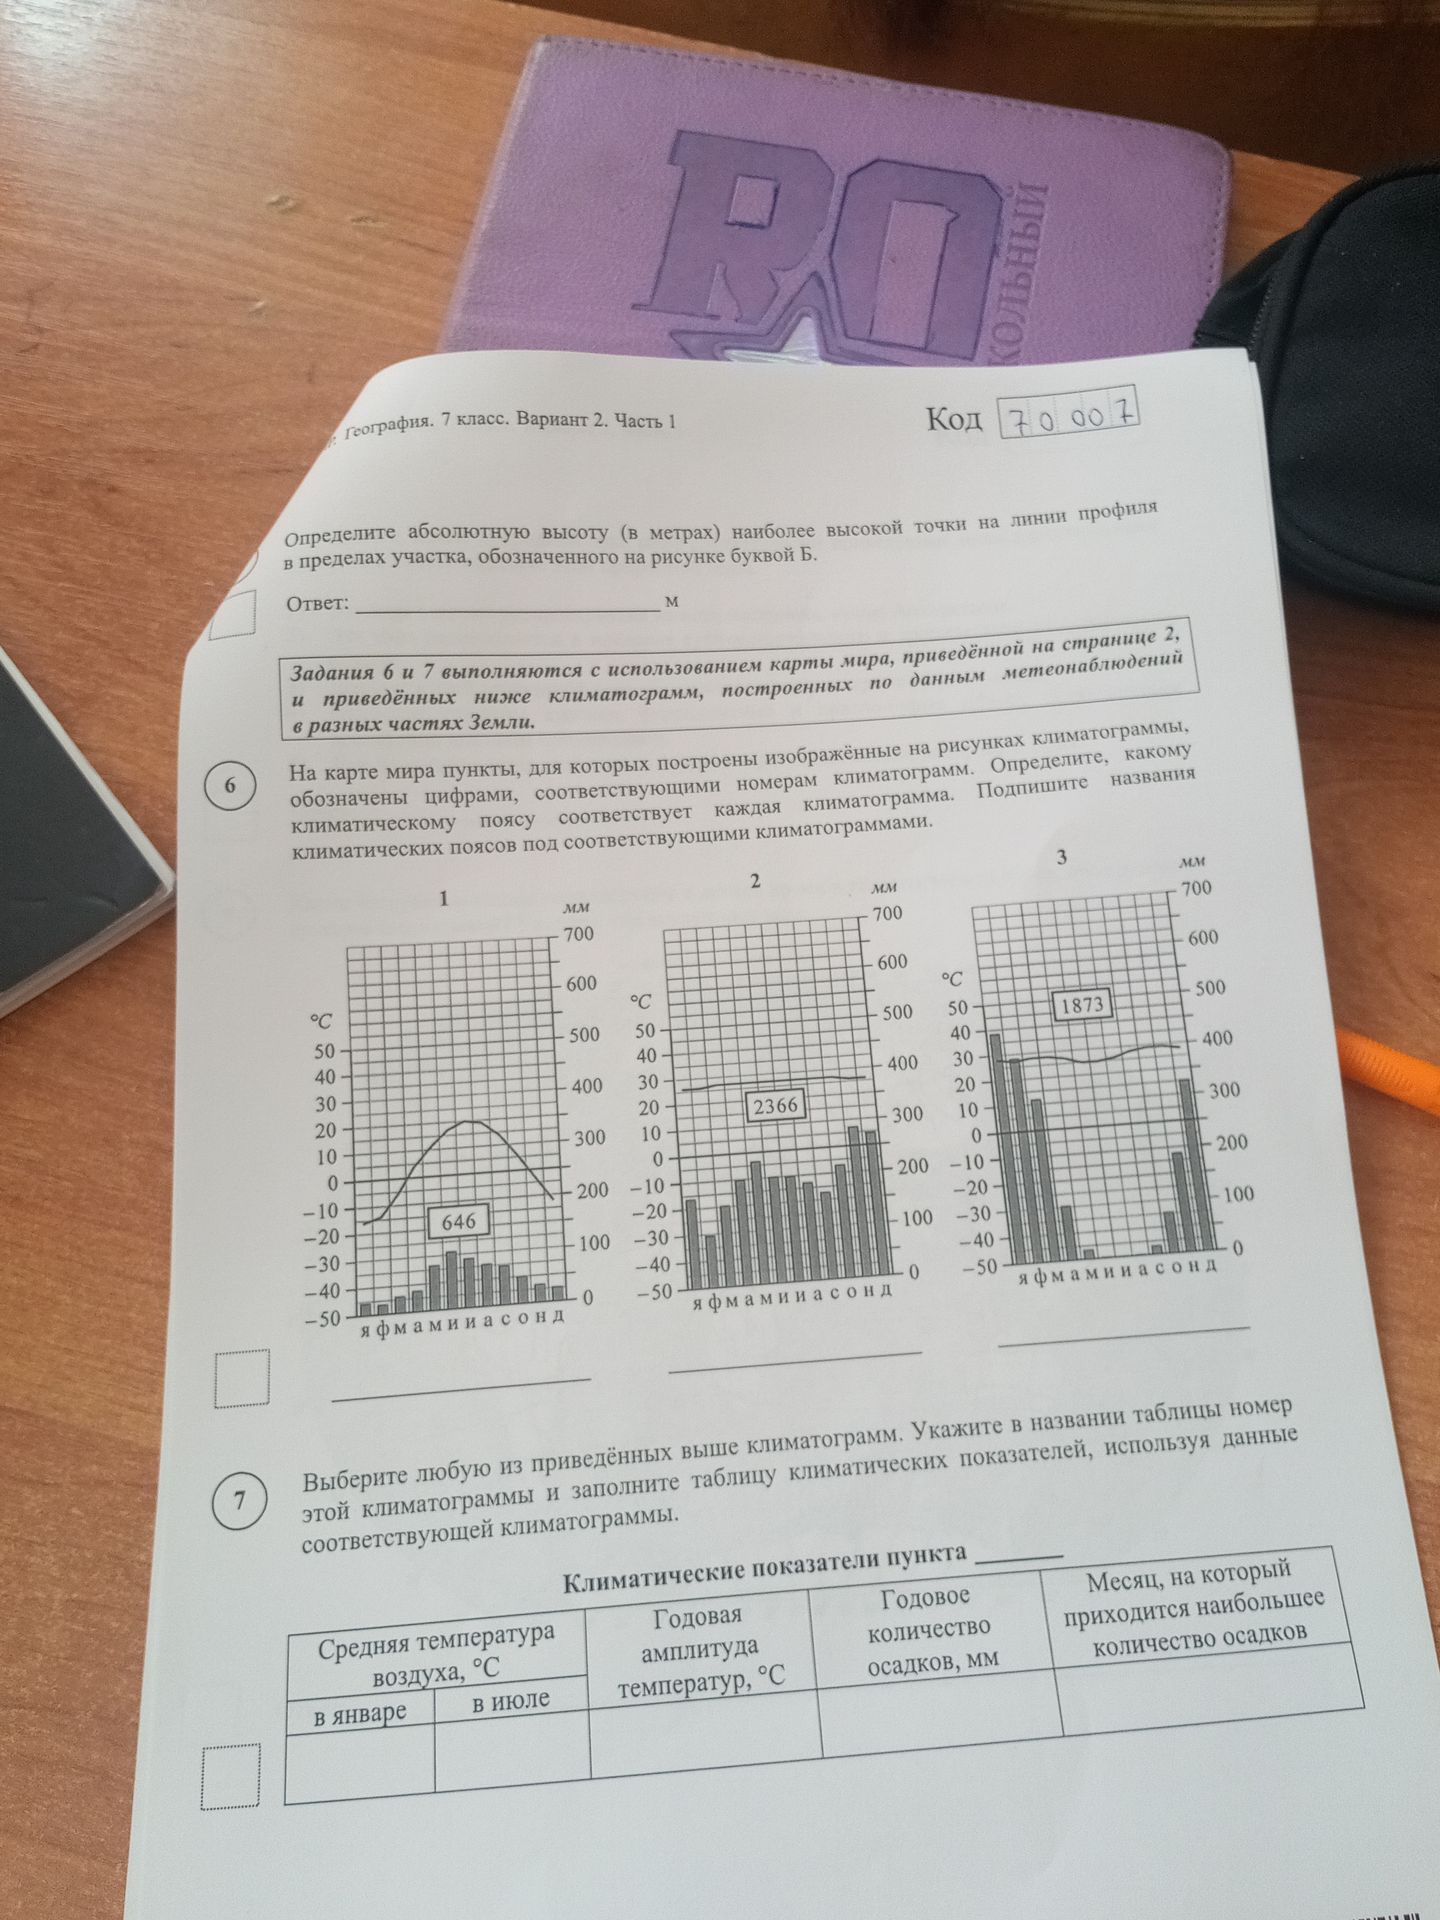
geography. 7 class. variant 2. part 1 code 70007 define the absolute altitude (in meters) of the highest point on the profile line in the area indicated on the drawing by the letter B. answer: m assignments 6 and 7 are performed using the world map shown on page 2 and the climate diagrams below, constructed from meteorological observations in different parts of the world. on the world map, the points for which the climate diagrams shown in the figures are constructed are denoted by numbers corresponding to the climate diagrams. determine which climatic zone each climate diagram corresponds to. sign the names of the climatic zones under the corresponding climate diagrams. 1 2 3 mm mm mm 700 700 700 600 600 600 °c °c °c 50 500 50 500 50 500 40 40 40 30 400 30 400 30 400 20 20 20 2366 10 300 10 300 10 300 0 0 0 -10 200 -10 200 -10 200 -20 646 -20 -20 -30 100 -30 100 -30 100 -40 -40 -40 -50 0 -50 0 -50 0 janfebmaraprmayjunjulaugsepoctnovdec j anfebmaraprmayjunjulaugsepoctnovdec j anfebmaraprmayjunjulaugsepoctnovdec choose any of the climate diagrams above. indicate the number of this climate diagram in the table title and fill in the table of climatic indicators using the data from the corresponding climate diagram. climate indicators of the point average air temperature, °c yearly amplitude of temperatures, °c annual precipitation, mm month with the largest amount of precipitation in january in july
Ответ:
Задание 7: Климатические показатели пункта
Выбираем климатограмму № 3.
| Климатические показатели пункта | |||||
|---|---|---|---|---|---|
| Средняя температура воздуха, °C | в январе | в июле | Годовая амплитуда температур, °C | Годовое количество осадков, мм | Месяц, на который приходится наибольшее количество осадков |
| Номер климатограммы 3 | -20 | 18 | 38 | 646 | Июль |
Вывод: Данная климатограмма №3 соответствует умеренному климатическому поясу.
