
 Алгебра
 Английский
 Биология
 География
 Геометрия
 История
 Русский
 Обществознание
 Физика
 Химия
Химия Информатика
 Литература
 Математика
Вопрос:
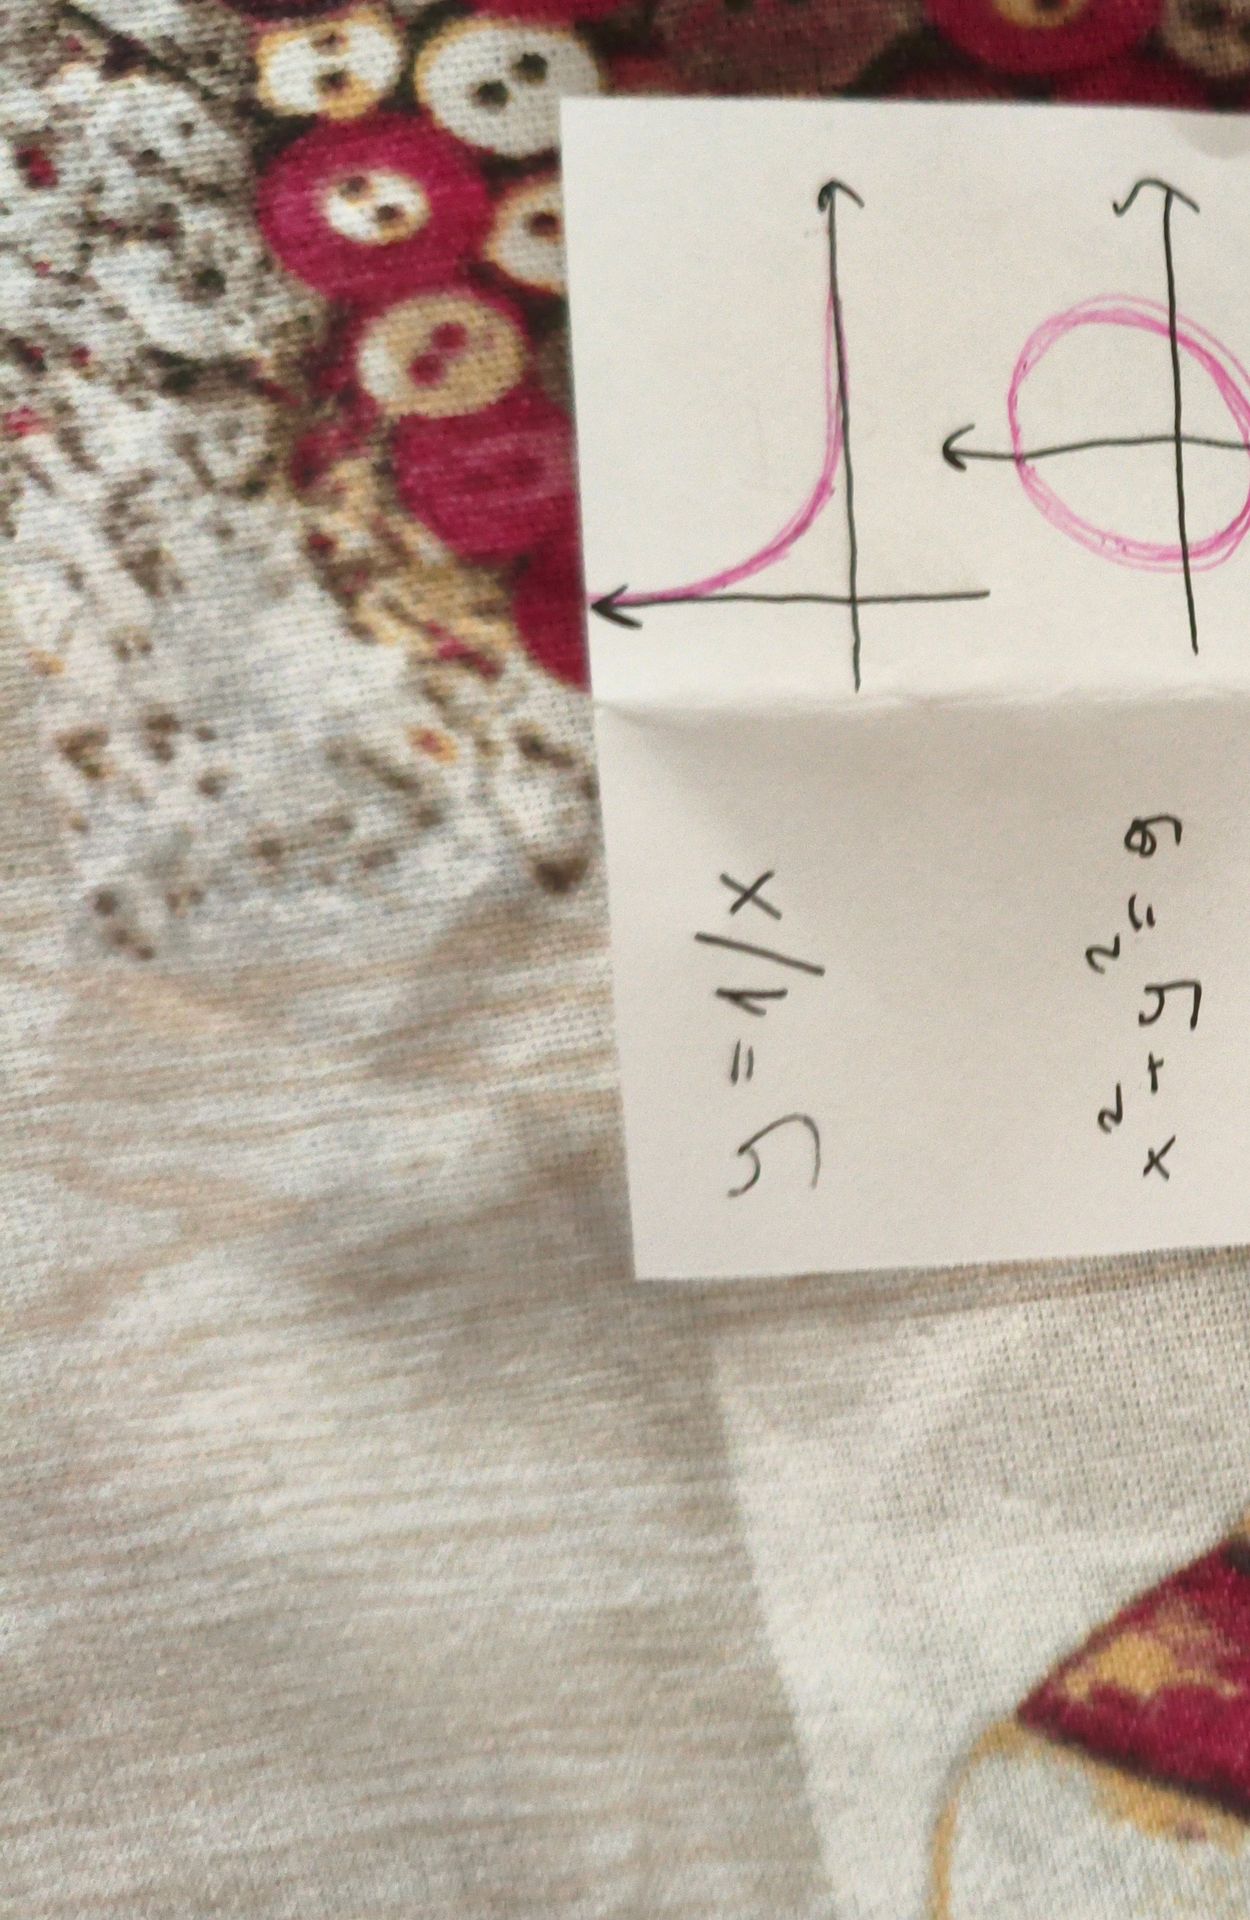
Identify the functions represented by the graphs and equations.
Ответ:
Function Identification
The image displays two graphs and two equations. We need to match them.
- Graph 1: This graph shows a curve that is decreasing and approaches the x-axis asymptotically from the right. It also has a vertical asymptote at the y-axis. This shape is characteristic of an exponential decay function or a reciprocal function in a specific quadrant. Given the context of typical school problems, and the shape resembling \( y = \frac{1}{x} \) in the first quadrant, this graph likely represents \( y = \frac{1}{x} \).
- Equation 1: \( y = \frac{1}{x} \). This is a reciprocal function. When \( x > 0 \), \( y > 0 \), and as \( x \) increases, \( y \) decreases, approaching 0. As \( x \) approaches 0 from the positive side, \( y \) approaches positive infinity. This behavior matches Graph 1 in the first quadrant.
- Graph 2: This graph shows a circle centered at the origin with a radius. The axes are marked, and there's an arrow pointing left from the circle, possibly indicating direction or a specific point on the circle. The shape is clearly a circle.
- Equation 2: \( x^2 + y^2 = 9 \). This is the standard equation of a circle centered at the origin \( (0,0) \) with a radius \( r \), where \( r^2 = 9 \). Therefore, the radius is \( r = 3 \). This equation represents Graph 2.
Match:
- Graph 1: Exponential decay / reciprocal function in the first quadrant.
- Equation 1: \( y = \frac{1}{x} \). This matches Graph 1.
- Graph 2: A circle centered at the origin.
- Equation 2: \( x^2 + y^2 = 9 \). This matches Graph 2.
Summary:
The first graph represents the function \( y = \frac{1}{x} \) (likely for \( x > 0 \)).
The second graph represents the circle with the equation \( x^2 + y^2 = 9 \).
