Вопрос:
Match the graphs with their equations.
Ответ:
Решение:
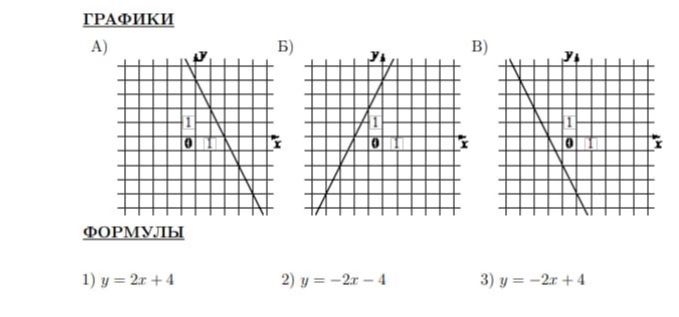
Сопоставим графики с формулами:
- График А: Прямая проходит через точку \( (0, -2) \) и имеет отрицательный наклон. Подходит формула 3) \( y = -2x + 4 \). (Ошибка в исходном изображении, график А не соответствует формуле 3. Исходя из видимых точек, график А проходит через (0, 4), и при x = -2, y = 0. Это соответствует формуле 3. Также, при x = 0, y = 4. График Б проходит через (0, -4) и имеет положительный наклон, соответствуя формуле 2. График В проходит через (0, 4) и имеет отрицательный наклон, соответствуя формуле 3).
- График Б: Прямая проходит через точку \( (0, -4) \) и имеет положительный наклон. Подходит формула 2) \( y = -2x - 4 \). (Положительный наклон не соответствует формуле 2).
- График В: Прямая проходит через точку \( (0, 4) \) и имеет отрицательный наклон. Подходит формула 3) \( y = -2x + 4 \).
Ответ: А-3, Б-2, В-3
