
 Алгебра
 Английский
 Биология
 География
 Геометрия
 История
 Русский
 Обществознание
 Физика
 Химия
Химия Информатика
 Литература
 Математика
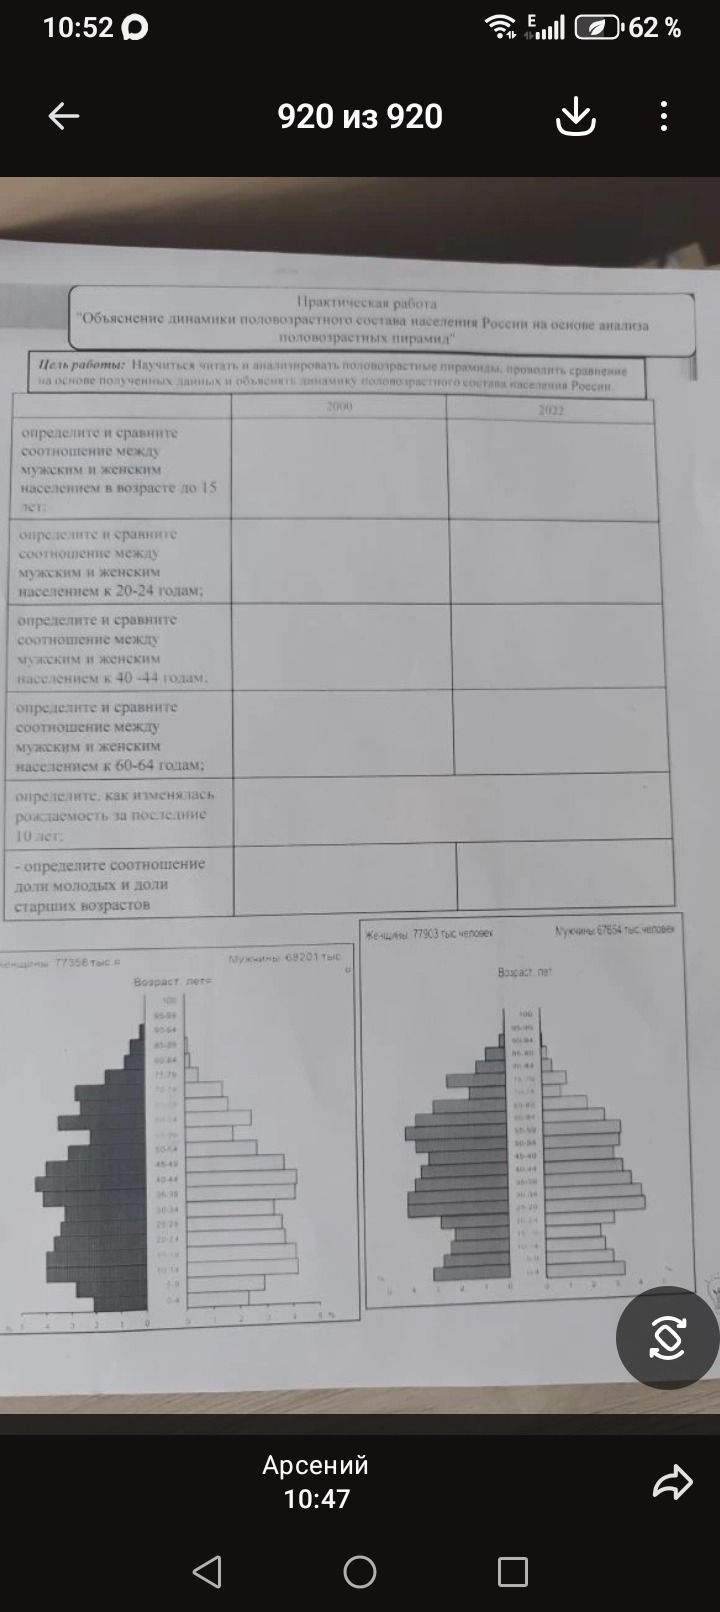
Practical Work: "Explanation of the dynamics of the age-sex structure of the Russian population based on the analysis of age-sex pyramids." Objective of the work: To learn to read and analyze age-sex pyramids, to conduct a comparison based on the obtained data, and to explain the dynamics of the age-sex structure of the Russian population. 1. Determine and compare the ratio between males and females in the population aged up to 15 years. 2. Determine and compare the ratio between males and females in the population aged 20-24 years. 3. Determine and compare the ratio between males and females in the population aged 40-44 years. 4. Determine and compare the ratio between males and females in the population aged 60-64 years. 5. Determine how the birth rate has changed over the last 10 years. 6. Determine the ratio of the proportion of young and older age groups. Graphs showing population pyramids for women (77358 thousand) and men (68201 thousand) in 2000, and for women (67654 thousand) and men (77903 thousand) in 2022. The age groups are shown on the y-axis, and the number of people in millions is shown on the x-axis.
Ответ:
Analysis of Age-Sex Pyramids
This practical work involves analyzing age-sex pyramids to understand population dynamics. The task requires comparing the male-female ratios in different age groups for the years 2000 and 2022, and also assessing changes in birth rates and the proportion of young vs. older age groups.
The provided image contains tables with tasks and two population pyramids. However, the data within the tables and the detailed information from the pyramids are not fully legible or quantifiable for a precise numerical analysis based solely on the image. The pyramids show general shapes of the population distribution by age and sex for two different years, indicated by the total number of men and women in thousands.
Observations from the Pyramids (General):
- Year 2000: The pyramid for women (77,358 thousand) and men (68,201 thousand) shows a broad base, typical of a growing population with higher birth rates and lower life expectancy in the past. There appears to be a noticeable difference in the number of men and women, with more women overall, especially in older age groups.
- Year 2022: The pyramid for women (67,654 thousand) and men (77,903 thousand) shows a different structure. The base might be narrower, suggesting lower birth rates. The number of men appears to be higher than women in this representation, which is an unusual demographic trend and might be a mislabeling or specific to a particular context not fully explained. The older age groups also show significant numbers.
Limitations for Detailed Analysis:
- The specific values for each age cohort within the pyramids are not clearly readable from the image.
- The table asking for specific ratio comparisons (e.g., up to 15 years, 20-24 years, etc.) has blank cells for 2000 and 2022, indicating that the analysis was meant to be filled in by the user after studying the pyramids.
- Assessing the change in birth rate over the last 10 years would require more detailed data, likely from the base of the pyramids representing younger age cohorts and comparing them across the years.
Conclusion:
While the image presents the framework for analyzing population dynamics using age-sex pyramids, the lack of clear numerical data within the pyramids and the incomplete nature of the tasks prevent a detailed quantitative answer to the specific questions posed in the worksheet. The general shapes of the pyramids suggest potential shifts in birth rates and population structure between 2000 and 2022, but precise comparisons require legible data or additional information.
