
 Алгебра
 Английский
 Биология
 География
 Геометрия
 История
 Русский
 Обществознание
 Физика
 Химия
Химия Информатика
 Литература
 Математика
Вопрос:
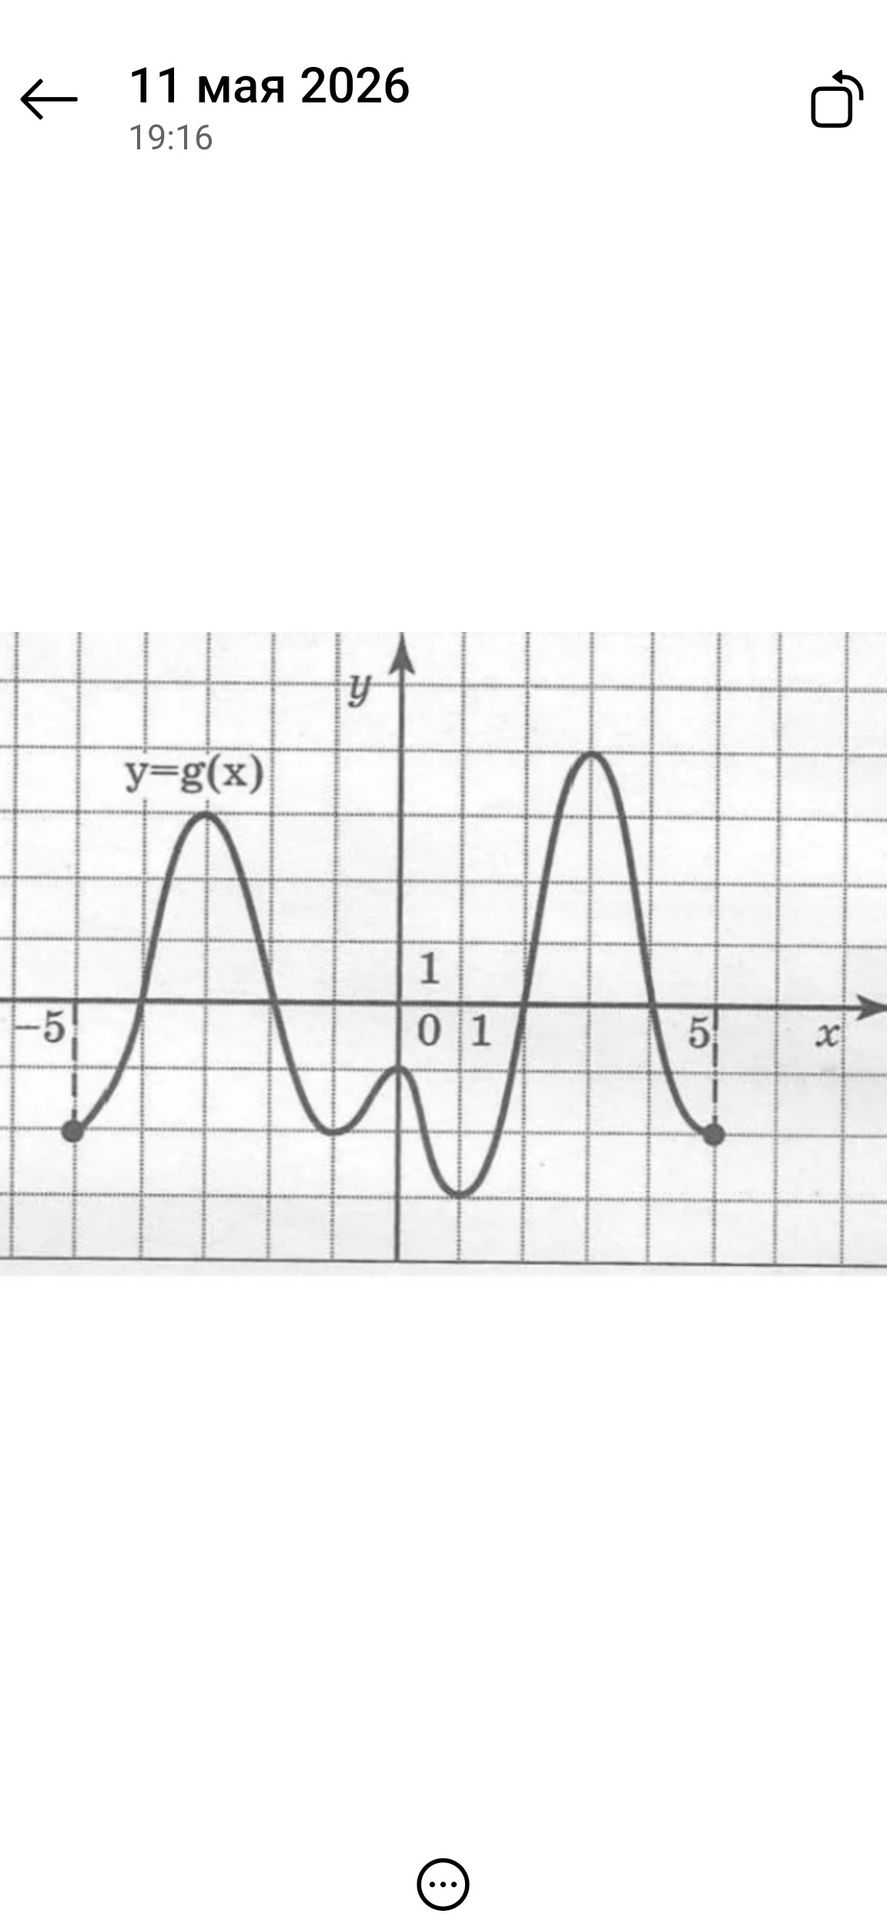
The image shows a graph of a function y=g(x).
Ответ:
The image displays a Cartesian coordinate system with the x and y axes. A curve labeled 'y=g(x)' is plotted on this system. The x-axis is marked with values such as -5, 0, and 5. The y-axis is also marked with values, including 1. The graph shows a function with several peaks and valleys. Specifically, there are two distinct rounded peaks and two troughs. There are also two solid dots on the graph, one near x=-5 and another near x=5, indicating specific points on the function. The grid lines suggest that each square represents one unit on both axes.
